Fig. 19
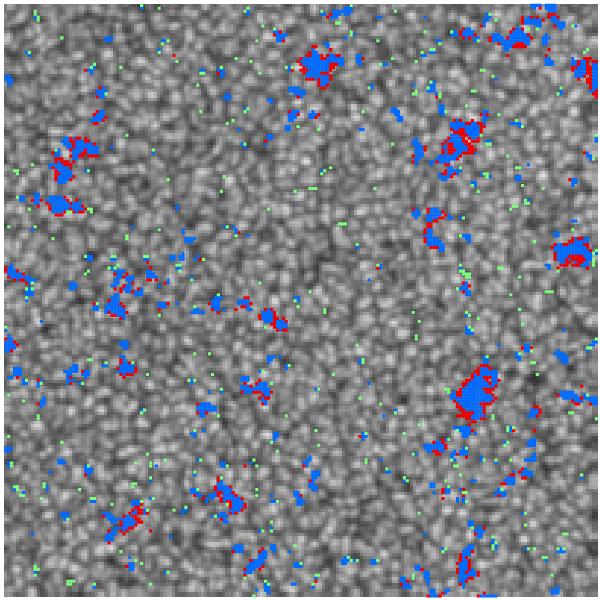
201 × 201 pixel inset, centred on disc centre, of the 720 s continuum intensity image, with the points displaying |⟨Bl⟩| > 3σ⟨Bl⟩ in the 720 s longitudinal magnetogram highlighted. Blue corresponds to the points realizing this condition in both the uncorrected and restored magnetogram, red the points fulfilling it only in the uncorrected data and green the points satisfying it only in the restored data. The grey scale is saturated at 0.8 and 1.2 times the mean quiet-Sun level.
Current usage metrics show cumulative count of Article Views (full-text article views including HTML views, PDF and ePub downloads, according to the available data) and Abstracts Views on Vision4Press platform.
Data correspond to usage on the plateform after 2015. The current usage metrics is available 48-96 hours after online publication and is updated daily on week days.
Initial download of the metrics may take a while.