Fig. 18
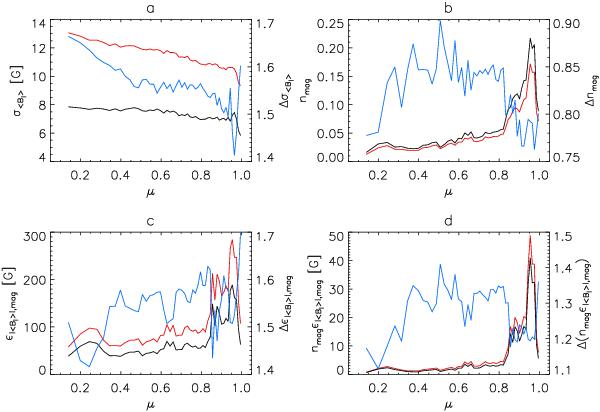
Plotted as a function of μ, a) the noise level of the 720 s longitudinal magnetogram, σ⟨Bl⟩, b) the proportion of image pixels counted as containing significant magnetic activity, nmag, c) the mean |⟨Bl⟩| of these points, ϵ|⟨Bl⟩| ,mag, d) and the product of nmag and ϵ|⟨Bl⟩| ,mag. Left axes: the uncorrected (black series) and restored with K2 levels (red series). Right axes: the quotient of the restored and uncorrected values (blue series).
Current usage metrics show cumulative count of Article Views (full-text article views including HTML views, PDF and ePub downloads, according to the available data) and Abstracts Views on Vision4Press platform.
Data correspond to usage on the plateform after 2015. The current usage metrics is available 48-96 hours after online publication and is updated daily on week days.
Initial download of the metrics may take a while.