Fig. 17
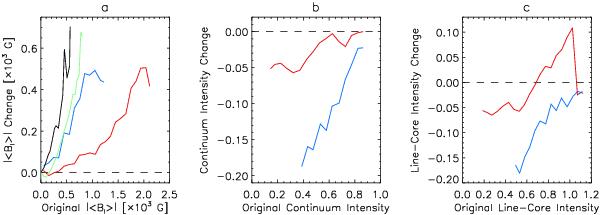
Change in |⟨Bl⟩| (left), as well as in the continuum (middle) and line-core intensity (right) introduced by image restoration with K2, as a function of the original value. Both the continuum and line core intensities are normalized to the quiet-Sun level. The red and blue series follow the values derived from the sunspot and pore features encircled by the similarly colour-coded contours in Fig. 14. The black and green curves (left) correspond to the change in |⟨Bl⟩| in the quiet Sun field depicted in Fig. 19, and in a 201 × 201 pixel active region field near disc centre (μ > 0.92), respectively. The dashed lines mark the zero level.
Current usage metrics show cumulative count of Article Views (full-text article views including HTML views, PDF and ePub downloads, according to the available data) and Abstracts Views on Vision4Press platform.
Data correspond to usage on the plateform after 2015. The current usage metrics is available 48-96 hours after online publication and is updated daily on week days.
Initial download of the metrics may take a while.