Fig. 16
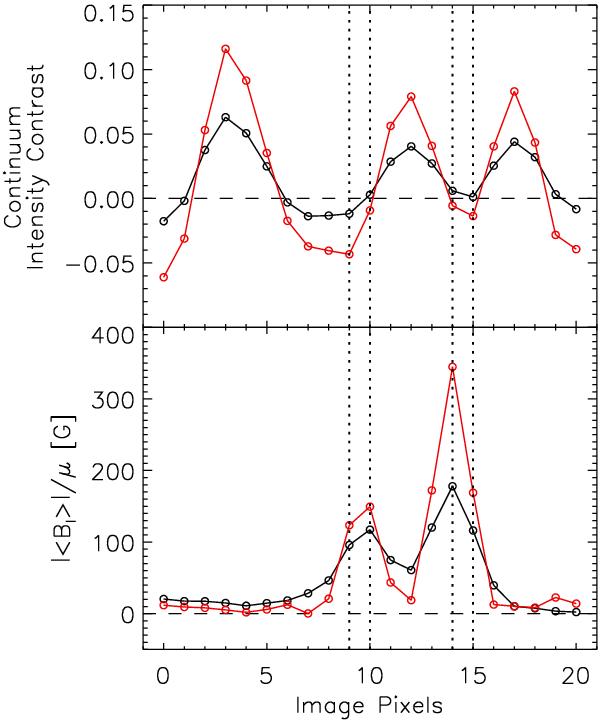
Uncorrected (black circles) and restored (with K2, red circles) continuum intensity contrast (top) and |⟨Bl⟩|/μ (bottom) along a 21 pixel section across magnetic features near disc centre (μ = 0.97). The plotted points represent image pixel values and are connected by straight lines to aid the eye. The dotted lines highlight the image pixels inside the magnetic features where the stray light correction effected a decrease in continuum intensity contrast accompanied by an increase in |⟨Bl⟩|/μ. The dashed lines follow the zero level.
Current usage metrics show cumulative count of Article Views (full-text article views including HTML views, PDF and ePub downloads, according to the available data) and Abstracts Views on Vision4Press platform.
Data correspond to usage on the plateform after 2015. The current usage metrics is available 48-96 hours after online publication and is updated daily on week days.
Initial download of the metrics may take a while.