Free Access
Fig. 15
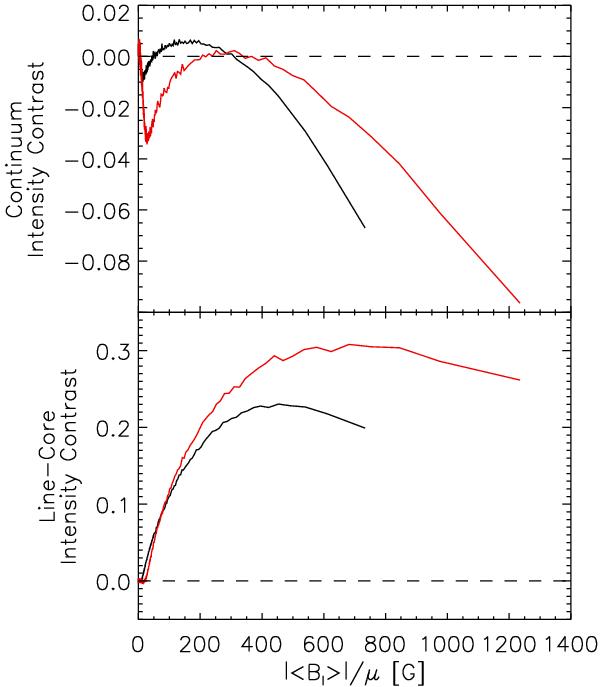
Continuum (top) and line core (bottom) intensity contrast of small-scale magnetic concentrations, near disc centre (μ > 0.94), as a function of |⟨Bl⟩|/μ. The black and red curves correspond to the values from the original and restored (with K2) data sets, respectively.
Current usage metrics show cumulative count of Article Views (full-text article views including HTML views, PDF and ePub downloads, according to the available data) and Abstracts Views on Vision4Press platform.
Data correspond to usage on the plateform after 2015. The current usage metrics is available 48-96 hours after online publication and is updated daily on week days.
Initial download of the metrics may take a while.