Fig. 14
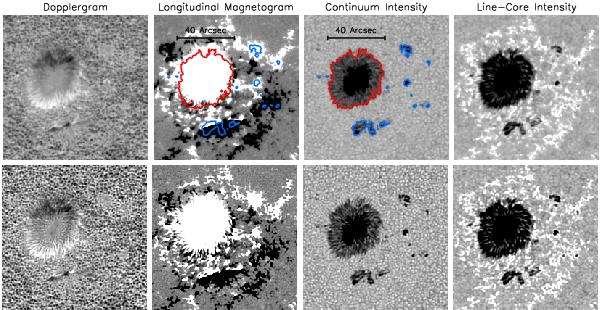
200 × 200 pixel (101 × 101 arcsec) inset, near disc centre (μ > 0.93), encompassing active region NOAA 11494, of the simultaneously recorded 720 s data products examined, before (top) and after (bottom) image restoration with K2. The grey scale is saturated at −1200 and 1200 ms-1 for the Dopplergrams, at − 100 and 100G for the longitudinal magnetograms, and at 0.6 and 1.2 for the continuum and line-core intensity images. The Dopplergram was corrected for the velocity of SDO relative to the Sun and for differential rotation (Sect. 3.2.4). Both the continuum and line-core intensity images were normalized to the mean quiet-Sun level (Sect. 3.2.1). The red and blue contours in the grey scale plot of the uncorrected longitudinal magnetogram and continuum intensity image follow I/I0 = (I/I0)QS,P, the quiet Sun to penumbra boundary. The colour coding is to distinguish the big sunspot feature (red) from the smaller sunspots and pores (blue), treated separately in Fig. 17.
Current usage metrics show cumulative count of Article Views (full-text article views including HTML views, PDF and ePub downloads, according to the available data) and Abstracts Views on Vision4Press platform.
Data correspond to usage on the plateform after 2015. The current usage metrics is available 48-96 hours after online publication and is updated daily on week days.
Initial download of the metrics may take a while.