Fig. 13
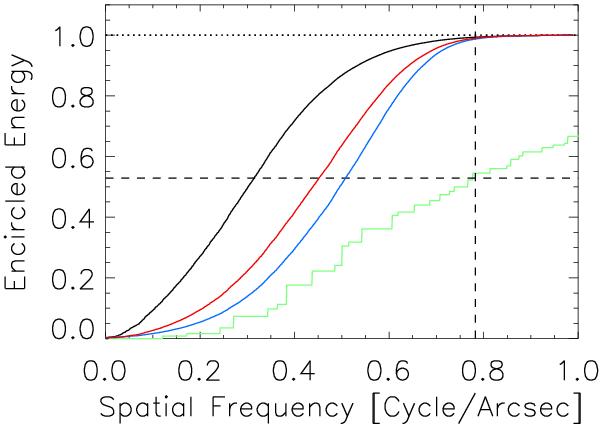
Encircled energy of the power spectrum of the 361 × 361 pixel inset, centred on the centre of the solar disc, of the test continuum filtergram, before (black), and after image restoration with K1 (blue) and with K2 (red). The green series gives the encircled energy of the mean power spectrum of the synthetic intensity maps corresponding to μ = 1.0. The vertical dashed line marks the cutoff spatial frequency (see text) of the restored (with K2) test continuum filtergram and the horizontal dashed line the encircled energy of the mean power spectrum of the μ = 1.0 synthetic intensity maps at this spatial frequency. The dotted line denotes encircled energy of unity.
Current usage metrics show cumulative count of Article Views (full-text article views including HTML views, PDF and ePub downloads, according to the available data) and Abstracts Views on Vision4Press platform.
Data correspond to usage on the plateform after 2015. The current usage metrics is available 48-96 hours after online publication and is updated daily on week days.
Initial download of the metrics may take a while.