Fig. 12
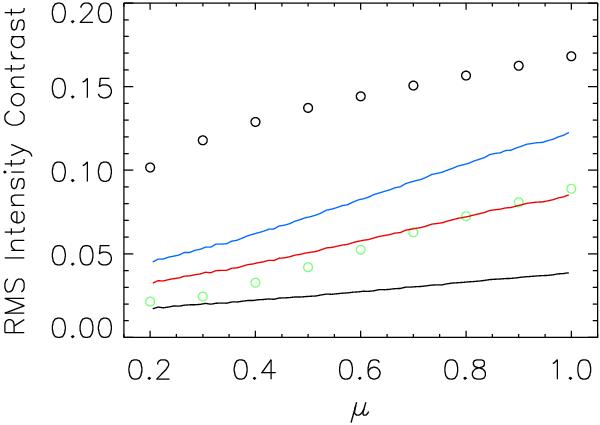
RMS intensity contrast of the quiet Sun in the test continuum filtergram as a function of μ, before (black curve), and after image restoration with K1 (blue curve) and with K2 (red curve). The black circles represent the values from the synthetic intensity maps and the green circles the same, rescaled to reflect the proportion arising from spatial frequencies up to the cutoff spatial frequency of the restored (with K2) test continuum filtergram (see text).
Current usage metrics show cumulative count of Article Views (full-text article views including HTML views, PDF and ePub downloads, according to the available data) and Abstracts Views on Vision4Press platform.
Data correspond to usage on the plateform after 2015. The current usage metrics is available 48-96 hours after online publication and is updated daily on week days.
Initial download of the metrics may take a while.