Fig. 10
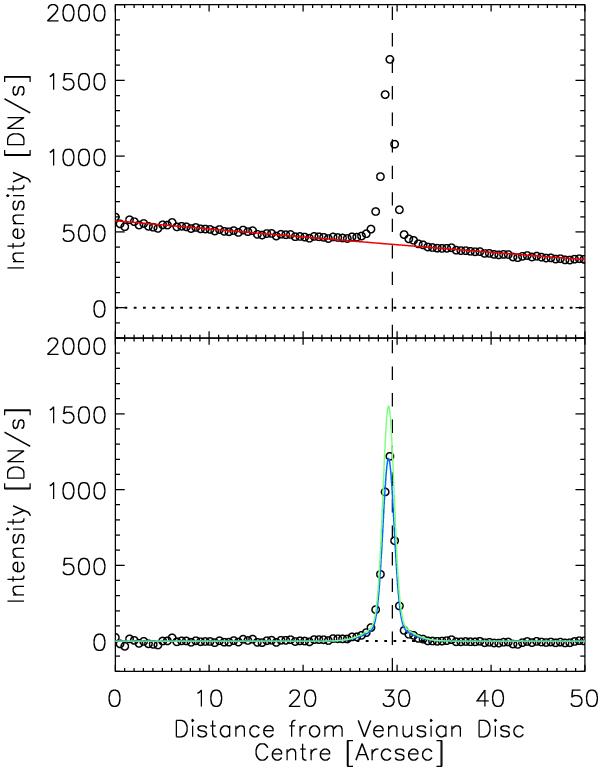
Intensity in the ingress image, averaged over the minor sector marked in Fig. 9, as a function of distance from the centre of the Venusian disc (circles); before (top panel) and after (bottom panel) subtracting the polynomial fit to the slowly varying background (red curve). The blue curve corresponds to the sum-of-two-Gaussians fit to the background-subtracted series, while the green curve is the same after scaling by the quotient of the total photospheric intensity behind the Venusian disc in the mean transit image and in the ingress image. The black dashed and dotted lines denote the position of the Venus limb (as given by the point of inflexion on Îr) and the zero intensity level, respectively.
Current usage metrics show cumulative count of Article Views (full-text article views including HTML views, PDF and ePub downloads, according to the available data) and Abstracts Views on Vision4Press platform.
Data correspond to usage on the plateform after 2015. The current usage metrics is available 48-96 hours after online publication and is updated daily on week days.
Initial download of the metrics may take a while.