Fig. 1
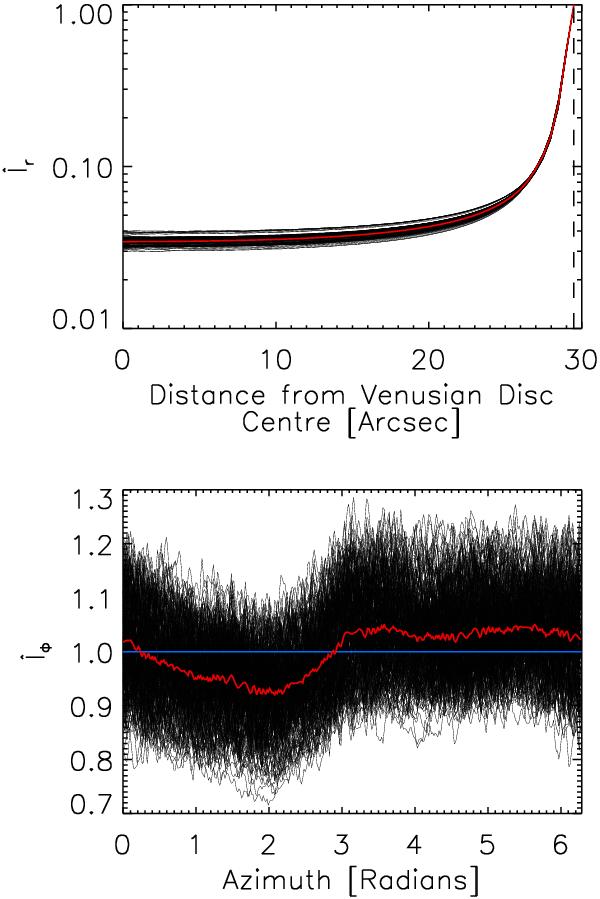
Intensity on the Venusian disc in the 249 continuum filtergrams from the transit of Venus. Top: intensity as a function of distance from the centre of the Venusian disc, averaged over all azimuths and normalized to the level at the point of inflexion (dashed line), Îr. Bottom: intensity versus azimuth along the edge of the Venusian disc as given by the point of inflexion on Îr, normalized to the mean level, Îφ. The red curves follow the mean Îr and Îφ of all the filtergrams, while the blue line represents Îφ = 1.
Current usage metrics show cumulative count of Article Views (full-text article views including HTML views, PDF and ePub downloads, according to the available data) and Abstracts Views on Vision4Press platform.
Data correspond to usage on the plateform after 2015. The current usage metrics is available 48-96 hours after online publication and is updated daily on week days.
Initial download of the metrics may take a while.