Fig. 6
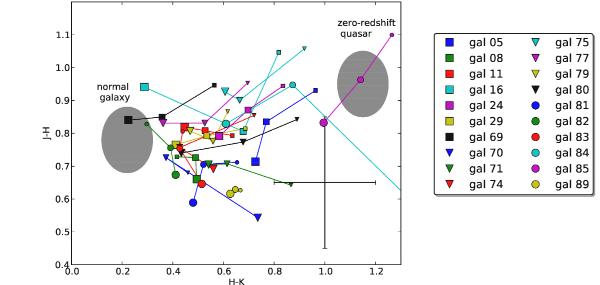
NIR two-color diagram of the 20 observed galaxies. The sizes of data points symbols indicate the different apertures (small: 14″, medium: 8″, and large: 1.6″ diameter). The error bars in the lower right corner indicate the typical error for individual measurements. The expected locations of normal (i.e. inactive) galaxies and zero-redshift quasars are indicated by ellipses.
Current usage metrics show cumulative count of Article Views (full-text article views including HTML views, PDF and ePub downloads, according to the available data) and Abstracts Views on Vision4Press platform.
Data correspond to usage on the plateform after 2015. The current usage metrics is available 48-96 hours after online publication and is updated daily on week days.
Initial download of the metrics may take a while.