Fig. 3
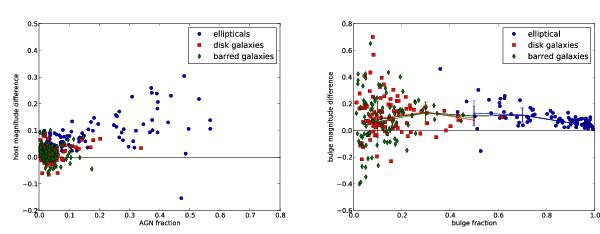
Quality of the AGN subtraction with Budda: difference between host galaxy in synthetic image and Budda fit in magnitudes (left), same for the bulge component (right), as a function of the fitted AGN (left) or bulge (right) luminosity fraction. Positive errors indicate that there is more flux in the model than in the original component, e.g. that the host galaxy or bulge resp. is overestimated; squares indicate disk-dominated galaxies; circles bulge-dominated galaxies, and diamonds barred galaxies. In the right panel, we mark trends by the mean and standard deviation of the data points in bins of 0.2 of the AGN/bulge fraction.
Current usage metrics show cumulative count of Article Views (full-text article views including HTML views, PDF and ePub downloads, according to the available data) and Abstracts Views on Vision4Press platform.
Data correspond to usage on the plateform after 2015. The current usage metrics is available 48-96 hours after online publication and is updated daily on week days.
Initial download of the metrics may take a while.