Fig. 2
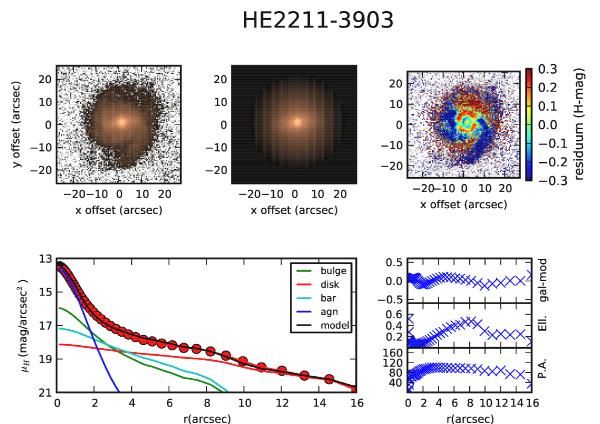
Example of decomposition with Budda. We show (from left to right) the original H-band image, the model and the residuum (galaxy/model). Blue indicates regions where the model is fainter than the galaxy, red indicates regions where the model is brighter than the galaxy. In the lower row, we show an elliptically averaged radial profile of the galaxy, the single components, and the whole model. In the ellipse fits of the model, ellipticity and position angle are fixed as those of the original image. Furthermore, we show the difference between galaxy and model, ellipticity and position angle.
Current usage metrics show cumulative count of Article Views (full-text article views including HTML views, PDF and ePub downloads, according to the available data) and Abstracts Views on Vision4Press platform.
Data correspond to usage on the plateform after 2015. The current usage metrics is available 48-96 hours after online publication and is updated daily on week days.
Initial download of the metrics may take a while.