Fig. 13
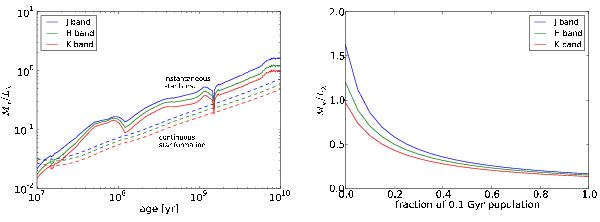
Left: M∗/Lλ ratio in J-, H-, and K-bands of the young stellar population as a function of age. Different colors indicate the three bands. The solid line shows an instantaneous star burst, the dashed line plots continuous star formation (1 M⊙ yr-1). Right: M∗/Lλ ratio as function of the mass fraction of a 0.1 Gyr population added to an old (10 Gyr) population.
Current usage metrics show cumulative count of Article Views (full-text article views including HTML views, PDF and ePub downloads, according to the available data) and Abstracts Views on Vision4Press platform.
Data correspond to usage on the plateform after 2015. The current usage metrics is available 48-96 hours after online publication and is updated daily on week days.
Initial download of the metrics may take a while.