Fig. 7

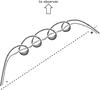
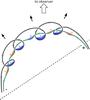
First proposed scenario. Two of the magnetic field lines with different degrees of twist are plotted, which belong to the flux rope underlying the filament. At the left, the flux rope is in equilibrium, while at the right it rises. The filament material is represented by the shadowed regions, where the colours indicate whether the material is blue- or redshifted relative to the observer (who is located above the top of the image). The dashed line is the photospheric polarity inversion line.
Current usage metrics show cumulative count of Article Views (full-text article views including HTML views, PDF and ePub downloads, according to the available data) and Abstracts Views on Vision4Press platform.
Data correspond to usage on the plateform after 2015. The current usage metrics is available 48-96 hours after online publication and is updated daily on week days.
Initial download of the metrics may take a while.