Fig. 4
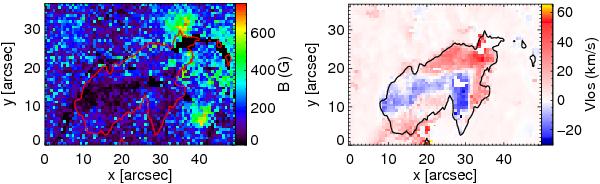
Left: map of the chromospheric magnetic field strength. Right: map of the mean value of the retrieved vLOS for the He components weighted with the respective filling factor α. Red and black contours outline the position of the filament as sampled by the spectropolarimeter’s scan. They are defined as I∗ = ∫(Ic − I)dλ = 2 × 10⁴ counts (see left panel of Fig. 3).
Current usage metrics show cumulative count of Article Views (full-text article views including HTML views, PDF and ePub downloads, according to the available data) and Abstracts Views on Vision4Press platform.
Data correspond to usage on the plateform after 2015. The current usage metrics is available 48-96 hours after online publication and is updated daily on week days.
Initial download of the metrics may take a while.