Fig. 3
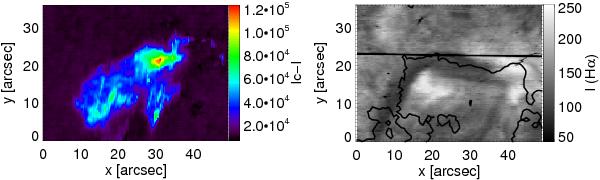
Left: He intensity map obtained by integrating Ic − I over the wavelength covered by the He absorption (10 828–10 835.7 Å). The intensity contribution of the photospheric and telluric spectral lines in the chosen wavelength range has been subtracted. Right: Hα image obtained with the slit-jaw camera at the VTT at 14:22:33 UT. The contour line indicates the position of the inversion line of the magnetic field in the photosphere, that is, where γ = 90° (see Fig. 2).
Current usage metrics show cumulative count of Article Views (full-text article views including HTML views, PDF and ePub downloads, according to the available data) and Abstracts Views on Vision4Press platform.
Data correspond to usage on the plateform after 2015. The current usage metrics is available 48-96 hours after online publication and is updated daily on week days.
Initial download of the metrics may take a while.