Fig. 2
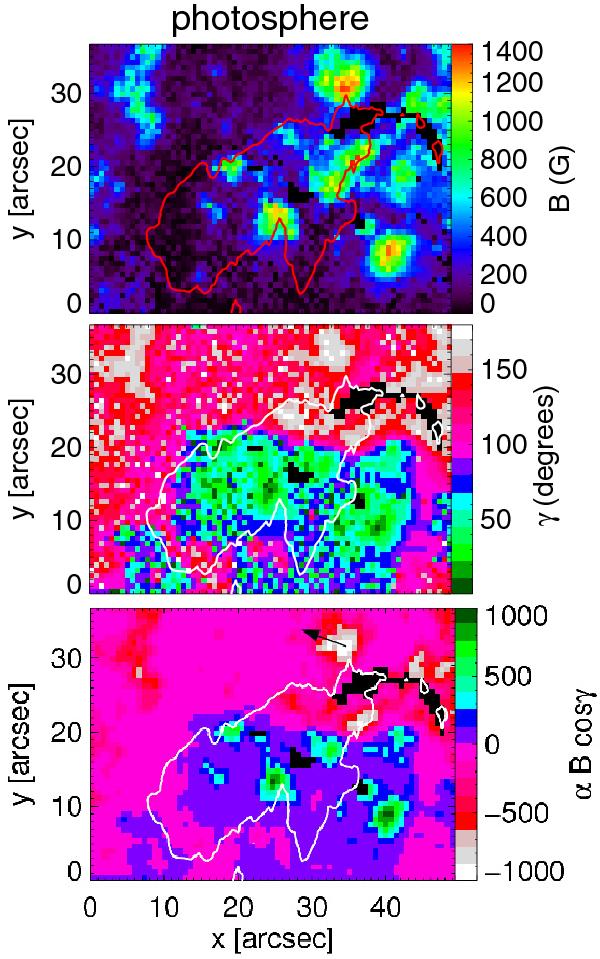
Upper panel: map of the photospheric magnetic field strength determined from the photospheric lines. Middle panel: map of the photospheric magnetic field inclination with respect to LOS. Lower panel: map of the photospheric flux density. Red and white contours outline the border of the filament. The black arrow in the lower panel indicates the direction towards the centre of the solar disc.
Current usage metrics show cumulative count of Article Views (full-text article views including HTML views, PDF and ePub downloads, according to the available data) and Abstracts Views on Vision4Press platform.
Data correspond to usage on the plateform after 2015. The current usage metrics is available 48-96 hours after online publication and is updated daily on week days.
Initial download of the metrics may take a while.