| Issue |
A&A
Volume 561, January 2014
|
|
|---|---|---|
| Article Number | A96 | |
| Number of page(s) | 7 | |
| Section | Stellar structure and evolution | |
| DOI | https://doi.org/10.1051/0004-6361/201322472 | |
| Published online | 13 January 2014 | |
XMM-Newton observations of 1A 0535+262 in quiescence
1 Institut für Astronomie und Astrophysik, Sand 1, 72076 Tübingen, Germany
e-mail: doroshv@astro.uni-tuebingen.de
2 AIM-CEA Saclay, 91191 Gif-sur-Yvette Cedex, Paris, France
3 Finnish Centre for Astronomy with ESO (FINCA), University of Turku, Väisäläntie 20, 21500 Piikkiö, Finland
4 Astronomy Division, Department of Physics, PO Box 3000, 90014 University of Oulu, Finland
5 Space Research Institute of the Russian Academy of Sciences, Profsoyuznaya Str. 84/32, 117997 Moscow, Russia
6 University of California, San Diego, Center for Astrophysics and Space Sciences, 9500 Dr. Gilman, La Jolla, CA 92093-0424, USA
Received: 12 August 2013
Accepted: 7 November 2013
Accretion onto magnetized neutron stars is expected to be centrifugally inhibited at low accretion rates. Several sources, however, are known to pulsate in quiescence at luminosities below the theoretical limit predicted for the onset of the centrifugal barrier. The source 1A 0535+262 is one of them. Here we present the results of an analysis of a ~50 ks long XMM-Newton observation of 1A 0535+262 in quiescence. At the time of the observation, the neutron star was close to apastron, and the source had remained quiet for two orbital cycles. In spite of this, we detected a pulsed X-ray flux of ~3 × 10-11 erg cm-2 s-1. Several observed properties, including the power spectrum, remained similar to those observed in the outbursts. Particularly, we have found that the frequency of the break detected in the quiescent noise power spectrum follows the same correlation with flux observed when the source is in outburst. This correlation has been associated with the truncation of the accretion disk at the magnetosphere boundary. We argue that our result, along with other arguments previously reported in the literature, suggests that the accretion in quiescence also proceeds from an accretion disk around the neutron star. The proposed scenario consistently explains the energy of the cyclotron line observed in 1A 0535+262, and the timing properties of the source including the spin frequency evolution within and between the outbursts, and the frequency of the break in power spectrum.
Key words: pulsars: individual: 1A 0535+262 / stars: neutron / binaries: general
© ESO, 2014
1. Introduction
The source 1A 0535+262 is one of the best-studied high mass X-ray binaries (HMXBs) of the Galaxy. The system hosts a Be star (Giangrande et al. 1980) and a neutron star in an eccentric orbit with e ~ 0.47 and orbital period of ~111 d (Finger et al. 1996). The neutron star is an accreting pulsar with spin period of ~103.3 s (Rosenberg et al. 1975), which exhibits outbursts associated with passage through the circumstellar disk of the primary in the vicinity of periastron. The X-ray luminosity reaches 1037−38 erg s-1 during the so-called normal and giant outbursts (assuming a distance of 2 kpc; Steele et al. 1998). The magnetic field of the neutron star has been estimated to be B ~ 5 × 10¹² G from the centroid energy of the so-called cyclotron resonance scattering feature (CRSF) observed at Ecyc ~ 45 keV in the X-ray spectrum of the pulsar. Unlike many other sources, 1A 0535+262 exhibits no significant variation of the line energy with luminosity, suggesting that the line is formed close to the surface of the neutron star (Caballero et al. 2013).
The variability of the source is not limited to coherent pulsations and outbursts. During the 1994 giant outburst, quasiperiodical oscillations (QPOs) with frequency in the range 27−72 mHz have been observed in the source’s hard (20−50 keV) X-ray light curve (Finger et al. 1996). The QPO frequency was found to be correlated with flux, as was recently confirmed by Fermi GBM observations in similar energy range (Camero-Arranz et al. 2012). This allowed the association of the QPOs with the inner edge of the accretion disk and the magnetosphere boundary (Finger et al. 1996; Camero-Arranz et al. 2012), although there are some problems with this interpretation.
Another manifestation of aperiodic variability in 1A 0535+262, is the broken power-law shape of the noise power spectrum, a feature common to many accreting pulsars (Hoshino & Takeshima 1993; Revnivtsev et al. 2009; Tsygankov et al. 2012). Revnivtsev et al. (2009), using RXTE observations carried out during the source outburst of 2009, were able to show that similarly to QPOs, the frequency of the break is correlated with flux, and proportional to the Keplerian frequency at the inner edge of the accretion disk where the disk is disrupted by the magnetosphere. The power spectrum was interpreted in the framework of the perturbation-propagation model proposed by Lyubarskii (1997) and Churazov et al. (2001), in which the fluctuations in accretion rate are associated with fluctuations in the accretion disk alpha parameter α, occurring on Keplerian timescales. This model predicts a P ~ f-1 power spectrum for the resulting accretion rate fluctuations, consistent with power spectra of accreting pulsars below the break (Revnivtsev et al. 2009). Above the break, instead, the observed spectra are steeper with P ~ f-2, which corresponds to the integrated white noise power spectrum with uncorrelated rate increments and can be naturally associated with free-falling plasma within the magnetosphere. The break in the power spectrum can therefore be associated with the disruption of the accretion disk, and the fact that this happens at a distance proportional to the magnetospheric radius strongly supports this interpretation.
Because it is a transient source, 1A 0535+262 is best studied at high luminosities during the outbursts associated with passage of the neutron star through the circumstellar decretion disk of the Be primary. When the neutron star leaves the vicinity of periastron and/or the decretion disk recedes, the density of the plasma surrounding the neutron star drops, and the source enters the so-called quiescence period with drastically reduced (if not ceased) X-ray flux (Reig 2011; Rothschild et al. 2013).
Accretion onto rotating magnetized neutron stars is expected to be centrifugally inhibited below a certain accretion rate (Illarionov & Sunyaev 1975), and it was long assumed that this is indeed the case for Be systems in quiescence. However, with the increased sensitivity of X-ray instruments, pulsed X-ray flux was detected from several sources, including 1A 0535+262, outside of outbursts, during states at luminosities below the critical known as the quiescent state (Motch et al. 1991; Campana et al. 2002; Orlandini et al. 2004; Rutledge et al. 2007; Rothschild et al. 2013). In 1A 0535+262 the quiescent flux is almost certainly powered by accretion (Negueruela et al. 2000; Ikhsanov 2001), although it is not clear how the matter leaks through the magnetosphere. To clarify the origin of its quiescent emission and the accretion mechanisms behind it, we observed 1A 0535+262 with XMM-Newton for 50 ks to investigate in detail the spectral and timing properties of the source in quiescence. The results are presented and discussed in this paper.
2. Observations and data analysis
We observed 1A 0535+262 with XMM-Newton for 50 ks on Feb. 28, 2012. At the time of observation, the neutron star was close to apastron, and the source had shown no outbursts in the two preceding orbital cycles. Therefore, 1A 0535+262 was certainly deep in quiescence. We also used the archival Suzaku observation (ID. 100021010) performed at the end of a normal outburst in Sep. 2005 as a reference to compare the quiescent and outburst spectra in the 0.2−12 keV energy range. In addition, we used all available observations of 1A 0535+262 by the Proportional Counter Array (PCA) onboard the Rossi X-ray Timing Explorer (RXTE) to investigate the aperiodic variability of the source at higher fluxes. The data reduction was carried out using the XMM SASv12.01 and HEASOFT 6.122 software packages.
In XMM data, the source was clearly detected with all three instruments with an average combined count-rate of about 5 counts/s and a factor of four more in a flare-like episode halfway through the observation, which corresponds to source flux of ~2.7 × 10⁻¹¹ erg cm-2 s-1 and luminosity of ~1.3 × 1034 erg s-1 assuming a distance of 2 kpc. The observation-long EPIC-PN light curve of 1A 0535+262 is presented in Fig. 1. The end of the observation (~18 ks) is severely affected by particle background, so we discard it in spectral analysis and only use it for timing.
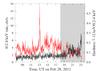 |
Fig. 1 Observation-long background-subtracted EPIC-PN light curve in the soft 0.2−4 keV energy range with time bin of 100 s (red), and hardness ratio for rates in 7−12 keV and 0.2−4 keV bands (black). Shaded area shows the part of the observation affected by enhanced particle background discarded in spectral analysis. |
2.1. Timing analysis
The search for pulsations and a detailed study of pulse-profiles was one of the main goals of our observation. For timing analysis, the photon arrival times were corrected for the orbital motion in the solar system and in the binary system using the ephemeris by Finger et al. (1996) with the adjusted epoch provided by the Fermi GBM Pulsar project3. We then extracted the light curve in the 0.2−12 keV energy band with 1 s time bins using the data combined from all three EPIC cameras. For this light curve, the Lomb-Scargle periodogram reveals a single highly significant peak at ~103.28 s coincident with the spin period of a neutron star, so we confirm that the X-ray flux is pulsed in quiescence.
To refine the pulse period and search for possible period evolution during the observation, we also performed a pulse-phase coherent timing analysis (Nagase et al. 1982; Doroshenko et al. 2010). We find that the data are consistent with a constant period of P = 103.286(6) s (all uncertainties are reported at a 1σ confidence level unless stated otherwise), and no pulse period derivative is required.
Using the refined period value, we folded the light curves in several energy ranges to obtain the pulse-profiles presented in Fig. 2. The pulse shape is sine-like and almost constant with energy, in line with earlier reports for the observations of the source in quiescence (Negueruela et al. 2000; Mukherjee & Paul 2005; Rothschild et al. 2013). As noted by Rothschild et al. (2013), in comparison with outburst observations, this simple shape resembles hard rather than soft pulse profiles.
Although we were unable to detect any change in pulse period during the XMM-Newton observation, the source is known to spin-down between the outbursts. To investigate the spin evolution of the source as a function of flux both in outburst and in quiescence, we used the Fermi GMB pulse frequency history provided for 1A 0535+262 by the GBM Pulsar archive3, which contains the measurements of the frequency and pulsed signal amplitude over a set of one- to two-day day intervals, when the source was in outburst.
To investigate changes of the source spin during outbursts, we compared the GBM Pulsar frequency values reported for adjacent time intervals averaging the left and right derivatives for each point (Doroshenko 2011). To estimate the uncertainty for the frequency derivative, we used the bootstrap technique, repeating this procedure 1000 times for frequencies normally distributed for each point within the reported GBM uncertainties, and averaged the results.
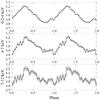 |
Fig. 2 Normalized energy-resolved pulse profiles folded with best-fit period using combined PN and MOS background subtracted light curves (background rate <0.7% in all cases). |
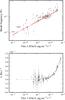 |
Fig. 3 Break frequency (top panel) and spin frequency derivative (bottom) as a function of flux and the best-fit model prediction for the joint fit as described in the text (red lines). |
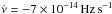
To determine the average spin-down rate in quiescence, we compared the frequencies (in the GBM Pulsar archive) at the end and at the onset of each pair of consequent outbursts observed by the GBM (see also Camero-Arranz et al. 2012 for more details). We also compared the frequency measured by GBM at the end of the most recent outburst with the one derived from the XMM data. By averaging these values, we estimated the spin-down between the outbursts to be 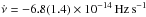 . The relatively large uncertainty reflects the scatter of individual measurements.
To study the luminosity dependence of the source spin, one also needs a reliable estimate of the source flux, which is not trivial in the case of the Fermi GBM, which can only measure the amplitude of pulsed flux. To determine the energy flux and the accretion rate from the GBM amplitudes, we used the available RXTE observations contemporary with the GBM measurements in order to calibrate observed pulsed amplitudes with the source flux derived from spectral fits. The flux and GBM amplitude were found to be well correlated with a rank correlation coefficient of r ~ 0.997 and f3−20 [erg cm-2 s-1] ~ 10-8A, where A is the pulsed flux amplitude measured by GBM. We use this dependence later on to estimate the flux for Fermi GBM observations.
To estimate the average quiescent flux, we used the best-fit spectral model for XMM data to scale the quiescent fluxes reported in the literature (Motch et al. 1991; Mukherjee & Paul 2005; Negueruela et al. 2000) to the same 3−20 keV energy range. Averaging the resulting values (also taking into account the value obtained for our XMM observation) implies a quiescent 3−20 keV flux of f3−20 ~ 2 × 10-11 erg cm-2 s-1. The dependence of the pulse frequency derivative on flux is presented in Fig. 3 (the lowest flux point corresponds to our estimate of average flux and frequency derivative, and the others correspond to the Fermi data).
Motivated by the analysis of aperiodic variability in 1A 0535+262 presented by Revnivtsev et al. (2009), we extended this study to our observation. For this analysis, we again used the full energy range (0.2−12 keV) light curve with a time bin of 1 s, combining the data from both MOS and PN cameras. The break around the pulse frequency is immediately apparent in the resulting power spectrum, although, as discussed by Revnivtsev et al. (2009), the contribution of the pulsed flux has to be removed to constrain the frequency of the break.
Best-fit spectral parameters for average and flare XMM and outburst Suzaku spectra fitted with cutoffpl and CompTT models, and for pulse-phase resolved XMM spectra fitted with the CompTT model.
To this end, Revnivtsev et al. (2009) subtracted the average pulse profile from each gap-free part of the light curve (i.e., each ten pulses, which corresponds to the average usable observation duration per RXTE orbit) before constructing the power spectra. This approach, however, may potentially act as a low-pass filter for frequencies below the inverse size of the window used to subtract the pulsed component. Moreover, because of the intrinsic variability of the pulse profiles, this window should not be too large otherwise the pulsed component cannot be subtracted completely. While it is not a concern for the RXTE light curves which are interrupted each orbit, our light curve contains no gaps and a different approach must be used to extend the power spectrum to lower frequencies. The simplest option is to ignore the frequencies corresponding to the harmonics of the pulse frequency of the pulsar when fitting the power spectrum, which is the conservative approach we follow. To fit the resulting power spectrum, we used a simple broken power-law model in the form P(f) = Nsignal(f/fbreak)αi + Nnoise. Here, fbreak is the break frequency, α1 > − 2 and α2 = −2 are power indices below and above the break, and Nsignal,noise are power-law and noise amplitudes. The choice of this model over of the King profile used by Revnivtsev et al. (2009) is motivated by the fact that the King profile, in addition to the two power laws in the spectrum, also includes a smooth transition region, which is not evident in the observed spectra and may affect the estimated break values.
These methodological differences complicate a direct comparison between the break frequency values reported by Revnivtsev et al. (2009) and the ones resulting from our XMM measurement. We therefore re-analyzed all available RXTE observations (including the data used by Revnivtsev et al. 2009) following the same procedure as for the XMM data. We only considered the PCA data for the analysis. We estimated the power spectrum for each RXTE observation by averaging the power spectra of continuous data segments within it. For further analysis, we only considered observations where the frequency break could be significantly detected.
The X-ray flux is derived for each observation from the observation-long X-ray spectrum fitted with an absorbed cutoff power-law model. In addition, we analyzed a single BeppoSAX observation of the source in quiescence, when pulsations were still detected (observation C in Mukherjee & Paul 2005). This observation contains, however, many data gaps due to the occultation of the source by the Earth, making it difficult to constrain the power spectrum at low frequencies and, consequently, the break frequency. The results are presented in Fig. 3. The correlation of the break frequency with flux reported by Revnivtsev et al. (2009) is confirmed and, moreover, seems to extend to the lowest fluxes where the pulsed flux from the source is still detected, with both BeppoSAX and XMM-Newton measurements following this trend. We note that in quiescence the break frequency approaches the spin frequency of the neutron star below which the accretion shall be inhibited centrifugally, which may explain the non-detection of pulsations at lower fluxes in BeppoSAX observations (observations A and B in Mukherjee & Paul 2005).
2.2. Spectral analysis
Broadband coverage, unfortunately lacking in our observation, is essential for a robust modeling and proper interpretation of the components of the continuum X-ray spectra of accreting pulsars. For instance, Naik et al. (2008) report a blackbody-like component with a temperature of ~1.4 keV, which is only required when the broadband spectrum is considered, while the fit of the soft spectrum (0.2−12 keV) alone does not require two components. The comparison of quiescent and outburst spectra in similar energy ranges, however, could clarify whether the spectrum changes or not. As a reference for this comparison, we use a ~43 ks long Suzaku observation (ID. 100021010) of 1A 0535+262 carried out at the end of a normal outburst in Sep. 2005 and analyzed in detail by Naik et al. (2008). We restrict the analysis to X-ray Imaging Spectrometer (XIS) data, which has a similar energy range to the XMM EPIC cameras and combine the spectra from the three front illuminated XIS units.
The effective exposure after rejection of periods with high particle background is about 33 and 37 ks for XMM PN and MOS, respectively. We extracted spectra and background separately for each camera, to account for differences in energy response, and we then fitted them simultaneously. In all cases spectra were re-binned to contain at least one hundred photons per bin. In addition, we separately considered the large flare which can be seen in Fig. 1 and lasts ~1.3 ks to probe for flux dependent spectral change within the XMM observation. We note that similar events have been reported by Hill et al. (2007) based on the INTEGRAL observations of the source. Flaring is probably normal for 1A 0535+262 in quiescence.
Both XMM and Suzaku XIS spectra are well fitted, either with single component models commonly used for the source, namely the absorbed cutoff power law, and the Comptonization model (CompTT in Xspec, see Titarchuk 1994). In the XMM data, there is no evidence of the fluorescence iron line marginally detected in the Suzaku spectrum (see also Caballero et al. 2013). We wish to note that both models are flexible enough to explain the blackbody-like soft component reported by Mukherjee & Paul (2005) and Naik et al. (2008) in the XMM energy range. The unfolded spectrum and best-fit model parameters for XMM average, flare, and the Suzaku XIS spectra are presented in Fig. 4 and Table 1. In XMM observation the source flux in the 0.2−12 keV energy range is 2 − 6 × 10-11erg cm-2 s-1 (on average and during the flare, respectively, i.e., at least a factor of six less than in the Suzaku observation), which corresponds to an average luminosity of ~1.3 × 1034erg s-1 assuming a distance of 2 kpc. Except for a difference in the inferred absorption column, the spectra are similar in shape, although the source gets softer as the flux decreases. To highlight these changes, in Fig. 4 ratios of the XMM average and flare spectra to the best-fit model for the outburst spectrum with adjusted normalization and absorption column fixed to the value measured by XMM are plotted. The outburst and flare spectra seem to have a similar shape, whereas the average quiescent XMM spectrum is slightly softer. Both models essentially describe the same Comptonization spectrum emerging from the hotspots on the surface of neutron star, so we refer to the CompTT for the rest of the paper because of the more straightforward interpretation of the parameters in this model.
The energy-related changes of the pulse profile shape suggest a pulse-phase dependence of the spectrum. To investigatethes we analyzed separately the XMM spectra in five equally spaced phase bins separately. The zero phase and binning were chosen in order to match the main features of the pulse profile, namely the hard shoulder, the dip after it, and the rising and falling shoulders of the main peak. The best-fit results for the pulse-phase resolved spectra with the CompTT model are presented in Fig. 5 and Table 1. There seems to be no strong phase dependence of spectral parameters, with the exception of the dip, where the spectrum significantly softens owing to a drop in the optical depth. This behavior is opposite to what one could expect due to the obscuration of the emission region by the accretion flow, and instead we seem to observe more directly the softer seed photons. One possibility is that we are looking at the polar cap directly through a hollow accretion column. This agrees qualitatively with the results of pulse profile decomposition carried out for the source by Caballero et al. (2011).
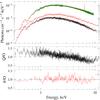 |
Fig. 4 Best-fit outburst, flare, and quiescent spectra (top to bottom in top panel) using the Suzaku XIS and the XMM PN data, and the ratio of XMM average (Q) and flare (F) spectra to best-fit model for Suzaku XIS outburst spectrum (O) with adjusted absorption column and normalization. |
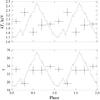 |
Fig. 5 Variation of the continuum parameters with pulse phase. The scaled pulse-profile in the 0.2−12 keV energy range is also plotted for reference. |
3. Discussion
The analysis of the XMM-Newton observation of 1A 0535+262 in quiescence and the comparison of the results with data from other satellites has revealed a phenomenology similar to that of the source in outburst:
-
The source is highly variable, with the flux increasing by a factor often during the flares. The average flux in quiescence also appearsto vary when compared to the quiescence fluxes reported withdifferent instruments.
-
The X-ray spectrum, particularly during the higher flux flare episode, is similar to that in outburst (within the XMM energy range).
-
Although the pulse profile is simplified in quiescence, some features typical of outburst profiles can still be seen. The amplitude of the pulsed flux is also similar.
-
The noise power spectrum exhibits the same broken power-law shape as at higher fluxes, and the break frequency follows the same correlation with flux as at higher luminosities.
-
The neutron star spins down in quiescence at an average rate of
 .
.
First of all, these results, in line with previous reports (Motch et al. 1991; Ikhsanov 2001), confirm that the observed emission is powered by the accretion of plasma from the primary onto the neutron star. Ikhsanov (2001) discussed why other mechanisms fail to explain the observed phenomenology, and detection of the break in the quiescent power spectrum may be the first direct evidence that the observed emission is indeed powered by accretion onto the magnetized neutron star. The question is, however, how the accretion proceeds.
In the case of the spherically symmetric accretion geometry, observed quiescent fluxes imply that the stationary accretion should be centrifugally inhibited (Illarionov & Sunyaev 1975; Motch et al. 1991). The magnetospheric radius  exceeds the co-rotation radius Rc = (GM/ω2)1/3 ~ 4 × 109 cm by a factor of two, so the magnetosphere rotates at a super-Keplerian velocity and, therefore, accretion is not possible. In the equation, μ is the dipole magnetic moment of the neutron star, M is the mass, and Ṁ is the accretion rate. In principle, plasma may still leak through the magnetosphere owing to various instabilities as discussed by Elsner & Lamb (1977), Perna et al. (2006) and Bozzo et al. (2008). For instance, for quiescent emission in 1A 0535+262, Ikhsanov (2001) considered instabilities associated with field line reconnection, concluding that the observed quiescent X-ray fluxes are compatible with the expected plasma leak rate, so quasispherical accretion is certainly not excluded.
On the other hand, Ikhsanov (2001) notes that for disk accretion the critical luminosity is lower, and, therefore, no additional instabilities are required to enable stationary accretion in this case. Chichkov et al. (1997) considered this possibility and concluded that, because of the fast rotation of the primary in 1A 0535+262, the accreting matter might have sufficient angular momentum to form an accretion disk around the neutron star at all orbital phases. Direct evidence of an accretion disk around the neutron star was reported by Giovannelli et al. (2007) based on the velocities derived from the observed doubling in the He I emission lines in the optical spectrum of the source. We note that at the time of the observation in Oct. 1999, the source remained X-ray quiet, although the neutron star was close to the periastron.
Moreover, the onset of the normal outburst in Sep. 2005 was accompanied by flaring activity (Caballero 2009), which Postnov et al. (2008) associated with magnetospheric instabilities emptying the inner regions of the accretion disk. This implies that an accretion disk was already in place at the beginning of outburst. Postnov et al. (2008) also noted that a similar mechanism might be responsible for short flare events like the one reported by Hill et al. (2007) (which appear to be very similar to the flare observed in our XMM observation).
It is interesting to note that the spin evolution of 1A 0535+262 is also consistent with disk accretion. Caballero (2009) has shown that the spin evolution of 1A 0535+262 in outburst seems to be in agreement with the predictions of the torque model by Ghosh & Lamb (1979) for the case of disk accretion. To verify if this is the case, and whether the same model can describe the spin-down of 1A 0535+262 between the outbursts, we have applied the same model to the observed spin-frequency derivative – flux dependence obtained as described above.
We considered the distance to the source, necessary to convert flux to accretion rate as the only free parameter. The uncertainty in accretion efficiency was assumed to be around ten percent and may also be attributed to uncertainty in distance. Other parameters of the model were fixed. The mass and radius of the neutron star were assumed to be M = 1.5 M⊙ and Rns = 13 km, respectively (Suleimanov et al. 2011), and the magnetic field was fixed to the value derived from the energy of the cyclotron line observed in 1A 0535+262. As discussed by Caballero et al. (2013), the cyclotron line energy is observed at E ~ 46 keV and does not change significantly with the luminosity. This implies that it most likely originates in the vicinity of the neutron star surface and, therefore, does provide an estimate of the magnetic field at the surface. In this case, B/1012 [G] = (1 + z)/11.57 × 46 [keV] ~ 4.9 × 10¹² G, where z is the gravitational redshift.
Even with these restrictions, the spin evolution of 1A 0535+262 is well described by the model (see Fig. 3). The best-fit distance was found to be d = 1.85(2) kpc, in excellent agreement with existing measurements. For this value of the distance, the model predicts 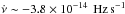 at average quiescence luminosity, which is in reasonable agreement with observations if one takes into account the uncertainty in the average flux value. We conclude, therefore, that the Ghosh & Lamb (1979) model for disk accretion describes the spin frequency evolution well, both during and between the outbursts.
The presence of a break in the noise power spectrum, and the flux−break frequency correlation revealed by RXTE observations in outburst, Revnivtsev et al. (2009), can be naturally interpreted as the disruption of the accretion disk at and by the magnetosphere. In this work, we have shown that the noise power spectrum at quiescent fluxes, obtained from our XMM observation has a similar shape as well. Moreover, we have extended the observed break frequency vs. flux correlation observed at higher fluxes during the outbursts to lower fluxes, which also suggests that the accretion geometry does not change in quiescence and that the accretion still proceeds from the disk.
Revnivtsev et al. (2009) have associated the break frequency with the Keplerian frequency at a radius proportional to the magnetosphere radius fb = νK(k·Rm) = (GM)1/2(k·Rm)− 3/2/2π. The magnetospheric radius as a function of the flux can be constrained from the spin evolution of the neutron star, so we can find k (and the source distance) simultaneously, fitting the spin frequency derivative and the break frequency as functions of flux. The best-fit values are d = 1.85(3) kpc, and k = 0.52(1). We note that the value of k matches the predictions of the Ghosh & Lamb (1979) model, so spin evolution and the break frequency changes are described self-consistently.
Finally, an independent estimate of the plasma velocity in the disk may be obtained from high-resolution X-ray spectroscopy. Reynolds & Miller (2010), using Chandra high-resolution grating spectra of two observations performed at the end of the 2009 outburst, observed the broadening of Fe Kα lines in the spectrum of 1A 0535+262, measuring velocities of ~5090(1000) km s-1 and ~4100(1000) km s-1, respectively. The two Chandra observations were almost simultaneous with RXTE observations 94323-05-03-03 and 94323-05-03-06. For these observations, we derive a flux in the 3−20 keV energy range of 1.63 × 10⁻⁸ erg cm-2 s-1 and 9.7 × 10⁻⁹erg cm-2 s-1 corresponding to break frequencies of 0.16 and 0.13 Hz, respectively, and to azimutal velocities in the disk of υφ = (2πνkGM)1/3 ~ 5900 km s-1and 5500 km s-1. These results are, within the uncertainty, consistent with the observations even without taking into account the unknown inclination of the disk.
Several independent lines of evidence suggest, therefore, that in 1A 0535+262, the accretion disk around the neutron star powers the accretion, not only in outbursts, but also in quiescence. A similar scenario may be realized in other Be systems as well, and may be very important for understanding the spin evolution of enclosed neutron stars and the physics of quasiperiodic outbursts. We would like to mention here the model proposed by Syunyaev & Shakura (1977) to explain irregular outbursts observed from transient neutron stars, where the authors argued that interaction of the accreting plasma with the magnetosphere may partially inhibit the accretion and lead to formation of the so-called “dead” disks, where the disk accumulates matter until it becomes unstable, resulting in an outburst. While it is clear that in 1A 0535+262 outbursts are closely related to the extension of the circumstellar disk of the primary, stability of the accretion disk around the neutron star may also be important. In particular, it may serve as a trigger for the onset of outbursts setting their exact timing, which would explain a relatively loose connection of the observed outbursts to periastron.
4. Conclusions
To clarify the origin of the quiescent X-ray emission in 1A 0535+262, we proposed, and were granted, a 50 ks observation with XMM-Newton, which was carried out on Feb. 28, 2012, when the neutron star was close to apastron. The system had exhibited no outburst activity since two orbital cycles preceding the observation, and thus was in X-ray quiescence. Similarly for earlier reports (Rothschild et al. 2013), we were able nevertheless to detect pulsed flux from the source at a level of ~2.6 × 10⁻¹¹ erg cm-2 s-1 and to perform detailed spectral and timing analysis. The derived pulse period of 103.286(6) s implies a spin-down with respect to the most recent outburst. Data quality unveiled for the first time a simplified, but still complex, shape of the pulse profiles in quiescence with certain features resembling the shapes of the outburst profiles.
We found that within the XMM-Newton energy range the X-ray spectrum is similar to that observed in outbursts, and even more so for the flare-like event with a flux factor of ~3 higher than average, which occurred during the observation. Taking into account similarities of the spectral and timing properties observed in quiescence and outbursts, it is clear that the observed flux is powered by accretion. We have also investigated the pulse-phase dependence of the spectrum, and found that the continuum parameters remain relatively stable with the pulse phase except for a sharp dip, which can also be traced in the outburst pulse profiles. There the spectrum softens, which can be interpreted as a decrease in optical depth of the Comptonizing region as, for instance, when the observer looks through a hollow column.
We also investigated the aperiodic variability in the source, and found that in quiescence the noise power spectrum shows the same broken power-law shape as during outburst observations, and moreover, the break frequency follows the same correlation with flux. We argue that this could be explained if the accretion geometry is similar in both cases, i.e., if the observed X-ray emission is powered by an accretion disk around the neutron star. Although quasispherical accretion cannot be ruled out, we find that this scenario allows us to consistently explain the observed break and spin frequency dependence on flux, and to discuss other previously published observational arguments which also support it.
It was proposed by Syunyaev & Shakura (1977) that centrifugal inhibition might lead to the formation of the so-called dead disks, where the matter is accumulated until the disk or magnetosphere becomes unstable. If this scenario is realized and the accretion disk is indeed ever present in 1A 0535+262, this may have important consequences for understanding the mechanisms that trigger the outbursts in transient neutron star Be systems, which may be related both to the size of circumstellar disk
of the primary, and to the stability of the accretion disk and magnetosphere as discussed by Postnov et al. (2008).
Acknowledgments
The authors thank M. Revnivtsev for many useful discussions and help with the power spectrum analysis. V.D. and A.S. thank the Deutsches Zentrums for Luft- und Raumfahrt (DLR) and Deutsche Forschungsgemeinschaft (DFG) for financial support (grant DLR 50 OR 0702).
References
- Bozzo, E., Falanga, M., & Stella, L. 2008, ApJ, 683, 1031 [NASA ADS] [CrossRef] [Google Scholar]
- Caballero, I. 2009, Ph.D. Thesis, IAAT University of Tuebingen [Google Scholar]
- Caballero, I., Kraus, U., Santangelo, A., Sasaki, M., & Kretschmar, P. 2011, A&A, 526, A131 [NASA ADS] [CrossRef] [EDP Sciences] [Google Scholar]
- Caballero, I., Pottschmidt, K., Marcu, D. M., et al. 2013, ApJ, 764, L23 [NASA ADS] [CrossRef] [Google Scholar]
- Camero-Arranz, A., Finger, M. H., Wilson-Hodge, C. A., et al. 2012, ApJ, 754, 20 [NASA ADS] [CrossRef] [Google Scholar]
- Campana, S., Stella, L., Israel, G. L., et al. 2002, ApJ, 580, 389 [NASA ADS] [CrossRef] [Google Scholar]
- Chichkov, M., Sunyaev, R., Sazonov, S., & Lund, N. 1997, in The Transparent Universe, eds. C. Winkler, T. J.-L. Courvoisier, & P. Durouchoux, ESA SP, 382, 291 [Google Scholar]
- Churazov, E., Gilfanov, M., & Revnivtsev, M. 2001, MNRAS, 321, 759 [NASA ADS] [CrossRef] [Google Scholar]
- Doroshenko, V. 2011, Ph.D. Thesis, Universität Tübingen [Google Scholar]
- Doroshenko, V., Santangelo, A., Suleimanov, V., et al. 2010, A&A, 515, A10 [NASA ADS] [CrossRef] [EDP Sciences] [Google Scholar]
- Elsner, R. F., & Lamb, F. K. 1977, ApJ, 215, 897 [NASA ADS] [CrossRef] [Google Scholar]
- Finger, M. H., Wilson, R. B., & Harmon, B. A. 1996, ApJ, 459, 288 [NASA ADS] [CrossRef] [Google Scholar]
- Ghosh, P., & Lamb, F. K. 1979, ApJ, 234, 296 [NASA ADS] [CrossRef] [Google Scholar]
- Giangrande, A., Giovannelli, F., Bartolini, C., Guarnieri, A., & Piccioni, A. 1980, A&AS, 40, 289 [NASA ADS] [Google Scholar]
- Giovannelli, F., Bernabei, S., Rossi, C., & Sabau-Graziati, L. 2007, A&A, 475, 651 [NASA ADS] [CrossRef] [EDP Sciences] [Google Scholar]
- Hill, A. B., Bird, A. J., Dean, A. J., et al. 2007, MNRAS, 381, 1275 [NASA ADS] [CrossRef] [Google Scholar]
- Hoshino, M., & Takeshima, T. 1993, ApJ, 411, L79 [NASA ADS] [CrossRef] [Google Scholar]
- Ikhsanov, N. R. 2001, A&A, 367 [Google Scholar]
- Illarionov, A. F., & Sunyaev, R. A. 1975, A&A, 39, 185 [NASA ADS] [Google Scholar]
- Lyubarskii, Y. E. 1997, MNRAS, 292, 679 [NASA ADS] [CrossRef] [Google Scholar]
- Motch, C., Stella, L., Janot-Pacheco, E., & Mouchet, M. 1991, ApJ, 369, 490 [NASA ADS] [CrossRef] [Google Scholar]
- Mukherjee, U., & Paul, B. 2005, A&A, 431, 667 [NASA ADS] [CrossRef] [EDP Sciences] [Google Scholar]
- Nagase, F., Hayakawa, S., Kunieda, H., et al. 1982, ApJ, 263, 814 [NASA ADS] [CrossRef] [Google Scholar]
- Naik, S., Dotani, T., Terada, Y., et al. 2008, ApJ, 672, 516 [NASA ADS] [CrossRef] [Google Scholar]
- Negueruela, I., Reig, P., Finger, M. H., & Roche, P. 2000, A&A, 356 [Google Scholar]
- Orlandini, M., Bartolini, C., Campana, S., et al. 2004, Nucl. Phys. B Proc. Suppl., 132, 476 [NASA ADS] [CrossRef] [Google Scholar]
- Perna, R., Bozzo, E., & Stella, L. 2006, ApJ, 639, 363 [NASA ADS] [CrossRef] [Google Scholar]
- Postnov, K., Staubert, R., Santangelo, A., et al. 2008, A&A, 480, L21 [NASA ADS] [CrossRef] [EDP Sciences] [Google Scholar]
- Reig, P. 2011, Ap&SS, 332, 1 [NASA ADS] [CrossRef] [Google Scholar]
- Revnivtsev, M., Churazov, E., Postnov, K., & Tsygankov, S. 2009, A&A, 507 [Google Scholar]
- Reynolds, M. T., & Miller, J. M. 2010, ApJ, 723, 1799 [NASA ADS] [CrossRef] [Google Scholar]
- Rosenberg, F. D., Eyles, C. J., Skinner, G. K., & Willmore, A. P. 1975, Nature, 256, 628 [Google Scholar]
- Rothschild, R., Markowitz, A., Hemphill, P., et al. 2013, ApJ, 770, 19 [NASA ADS] [CrossRef] [Google Scholar]
- Rutledge, R. E., Bildsten, L., Brown, E. F., et al. 2007, ApJ, 658 [Google Scholar]
- Steele, I. A., Negueruela, I., Coe, M. J., & Roche, P. 1998, MNRAS, 297, L5 [NASA ADS] [CrossRef] [Google Scholar]
- Suleimanov, V., Poutanen, J., Revnivtsev, M., & Werner, K. 2011, ApJ, 742, 122 [NASA ADS] [CrossRef] [Google Scholar]
- Syunyaev, R. A., & Shakura, N. I. 1977, Sov. Astron. Lett., 3, 138 [NASA ADS] [Google Scholar]
- Titarchuk, L. 1994, ApJ, 434, 570 [NASA ADS] [CrossRef] [Google Scholar]
- Tsygankov, S. S., Krivonos, R. A., & Lutovinov, A. A. 2012, MNRAS, 421, 2407 [NASA ADS] [CrossRef] [Google Scholar]
All Tables
Best-fit spectral parameters for average and flare XMM and outburst Suzaku spectra fitted with cutoffpl and CompTT models, and for pulse-phase resolved XMM spectra fitted with the CompTT model.
All Figures
|
Fig. 1 Observation-long background-subtracted EPIC-PN light curve in the soft 0.2−4 keV energy range with time bin of 100 s (red), and hardness ratio for rates in 7−12 keV and 0.2−4 keV bands (black). Shaded area shows the part of the observation affected by enhanced particle background discarded in spectral analysis. |
| In the text | |
|
Fig. 2 Normalized energy-resolved pulse profiles folded with best-fit period using combined PN and MOS background subtracted light curves (background rate <0.7% in all cases). |
| In the text | |
|
Fig. 3 Break frequency (top panel) and spin frequency derivative (bottom) as a function of flux and the best-fit model prediction for the joint fit as described in the text (red lines). |
| In the text | |
|
Fig. 4 Best-fit outburst, flare, and quiescent spectra (top to bottom in top panel) using the Suzaku XIS and the XMM PN data, and the ratio of XMM average (Q) and flare (F) spectra to best-fit model for Suzaku XIS outburst spectrum (O) with adjusted absorption column and normalization. |
| In the text | |
|
Fig. 5 Variation of the continuum parameters with pulse phase. The scaled pulse-profile in the 0.2−12 keV energy range is also plotted for reference. |
| In the text | |
Current usage metrics show cumulative count of Article Views (full-text article views including HTML views, PDF and ePub downloads, according to the available data) and Abstracts Views on Vision4Press platform.
Data correspond to usage on the plateform after 2015. The current usage metrics is available 48-96 hours after online publication and is updated daily on week days.
Initial download of the metrics may take a while.