Fig. 18
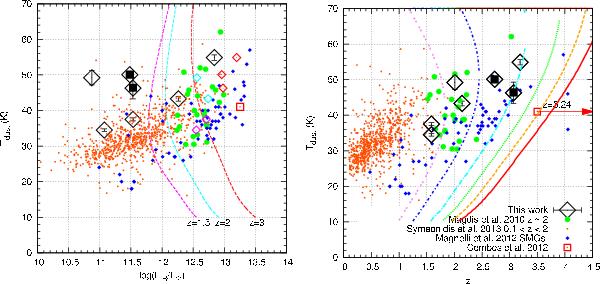
Left: LIR vs. Tdust diagram, plotted against the larger sample of Symeonidis et al. (2013, orange dots), that of Magdis et al. (2010, green circles), and the SMG sample of (Magnelli et al. 2012a, blue diamonds). cB58 and the poorly constrained Cosmic Eye are shown by black squares surrounded by a diamond. Our sample (large hollow diamonds) has warmer Tdust compared to galaxies with same luminosity at lower redshift. Our sample has similar temperatures to the ULIRG sample of Magdis et al. (2010), indicating overall warmer temperatures at z ~ 2 or more than in the more local Universe. The SMGs that lie closest to our sample in this parameter space and appear warmer than the main SMG trend are among the most strongly lensed ones in the Magnelli et al. (2012a) sample, suggesting we have similar objects in our two surveys. The three dashed curves represent the PACS160 5σ detection limits at the redshifts mentioned below them. The smaller hollow color-coded diamonds represent the observed (lensed) luminosities of our sources, which we can see lie well above their corresponding limiting curves. Right: redshift vs. Tdust diagram. Our sample lies together the z ~ 2 ULIRGs and with many of the SMGs at same redshift. Compared to the latter in particular, our sample has similar temperatures with the SMGs that are in the ULIRG − HyLIRG regime, again indicating no strong evolution of Tdust with LIR at the considered redshifts. The rainbow colored curves represent, from left to right, the 5σ limits in Tdust per redshift for an object of respective LIR = [1,2,4,6,8,10 × 1012 L⊙]. This illustrates that for their corresponding luminosities and redshifts, our objects lie way above the minimal detectable Tdust.
Current usage metrics show cumulative count of Article Views (full-text article views including HTML views, PDF and ePub downloads, according to the available data) and Abstracts Views on Vision4Press platform.
Data correspond to usage on the plateform after 2015. The current usage metrics is available 48-96 hours after online publication and is updated daily on week days.
Initial download of the metrics may take a while.