Fig. 15
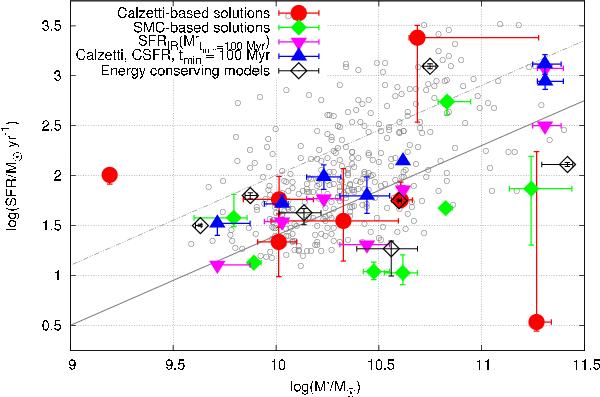
Mass-SFR diagram, with the values obtained by the various stellar population models plus the IR-inferred SFRs (red circles: Calzetti-based exponentially declining models with nebular emission; green diamonds: same but with SMC; upwards blue triangles: the classic models assuming Calzetti, constant SFR, and tmin = 100 Myr; downwards purple triangles: IR-inferred SFRs vs. mass from SFR = const. model; black hollow diamonds: energy conserving models). Also plotted are the Daddi et al. (2007) main sequence for z ~ 2 from the GOODS field (grey continuous line), and the relation 4 times above this main sequence as shown in Rodighiero et al. (2011) (grey dot-dot-dashed line).
Current usage metrics show cumulative count of Article Views (full-text article views including HTML views, PDF and ePub downloads, according to the available data) and Abstracts Views on Vision4Press platform.
Data correspond to usage on the plateform after 2015. The current usage metrics is available 48-96 hours after online publication and is updated daily on week days.
Initial download of the metrics may take a while.