Fig. 14
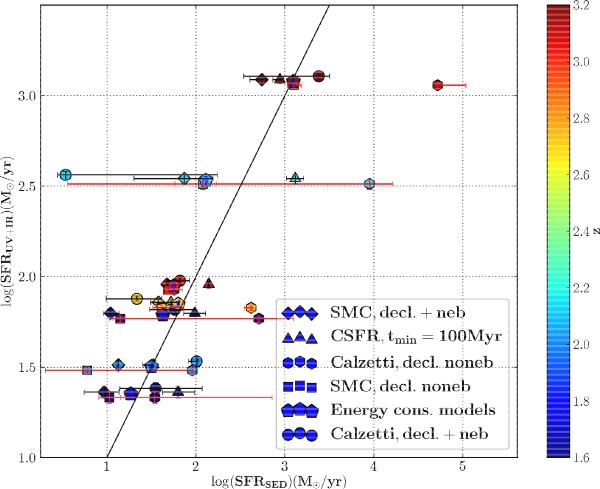
SFRIR + SFRUV vs. SFRSED (SFRBC in the rest of the text) diagram. The straight line indicates unity. The various symbols correspond to the models shown in the key, and colors correspond to redshift according to the colorbar. For more clarity, the error bars of the models without nebular emission are in red and slight vertical shifts are imposed for all objects to better separate them.
Current usage metrics show cumulative count of Article Views (full-text article views including HTML views, PDF and ePub downloads, according to the available data) and Abstracts Views on Vision4Press platform.
Data correspond to usage on the plateform after 2015. The current usage metrics is available 48-96 hours after online publication and is updated daily on week days.
Initial download of the metrics may take a while.