Fig. 1
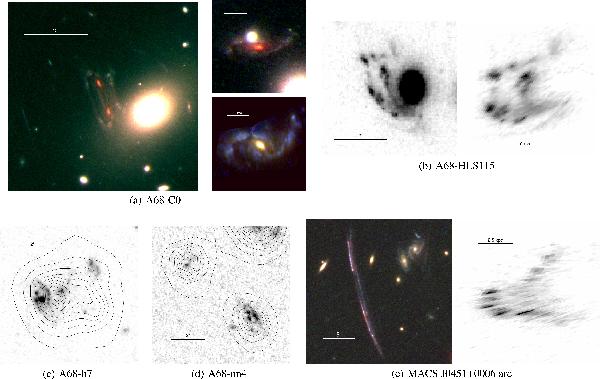
a) RGB rendering of A68/C0 using the F160W, F814W, and F702W HST bands. Left: images A68-C0a and A68-C0b forming a broad quasi-symmetrical arc near the cluster BCG. Upper right: third, less magnified and less distorted image, A68-C0c. Lower right: source plane reconstruction of A68-C0c after removal of the overlapping elliptical. Some residuals of the subtraction remain. b) ACS/F814W image and source plane reconstruction of A68-HLS115. Again, the neighboring elliptical has been removed in the reconstruction. c) ACS/F814W image of A68-h7 with IRAC/ch2 contours. This source consists of an interacting system of four separate components, the most extinguished of which is the southwest component. Although the exact relation of each of the components to one another is unknown, their morphology and photometry is consistent with all of them being related and forming a coherent system. d) ACS/F814W image of A68-nn4 with IRAC/ch2 contours. This source consists of a pair of interacting galaxies. We focus on the northeast component as it is the most extinguished and appears to be the most related to the IR emission. e) Left: RGB rendering of the giant arc in MACSJ0451+0006 using the F140W, F814W, and F606W HST bands. The arc is 20′′ long, and can be separated in two main components: the northern part and the southern part. The northern arc is a double image of the northern part of the source. The critical line runs through the middle of it. The southern arc is a single stretched image of the rest of the source. The two parts can be separated in Herschel up to 250 μm. The IR emission in the south appears to be dominated by an AGN, so we consider here only the northern, and starburst component, of the IR emission. Right: ACS/F606W source plane reconstruction of the arc. The morphology suggests a merger, despite ambiguious kinematics (Jones et al. 2010).
Current usage metrics show cumulative count of Article Views (full-text article views including HTML views, PDF and ePub downloads, according to the available data) and Abstracts Views on Vision4Press platform.
Data correspond to usage on the plateform after 2015. The current usage metrics is available 48-96 hours after online publication and is updated daily on week days.
Initial download of the metrics may take a while.