Fig. 9
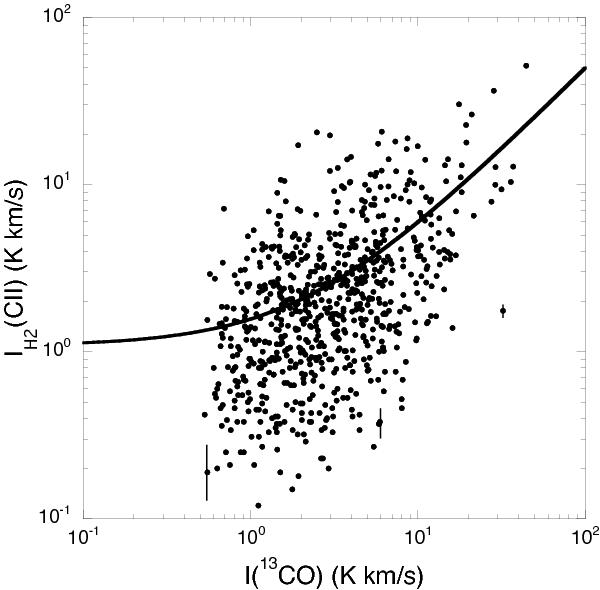
IH2([C ii]), the intensity of [C ii] in the H2 layer plotted against I(13CO) on a log-log scale. There is a trend towards larger IH2([C ii]) with increasing I(13CO). The solid line shows a linear fit to the data, IH2([C ii]) = 1.08 + 0.49 I(13CO), which appears curved when transformed to the log-log plot shown here. The 1-σ noise for IH2([C ii]) is indicated on three points; those for I(13CO) are too small to be visible on this figure and have been omitted. It can be seen on the scale of this figure that the S/N is high for most of points in this scatter plot.
Current usage metrics show cumulative count of Article Views (full-text article views including HTML views, PDF and ePub downloads, according to the available data) and Abstracts Views on Vision4Press platform.
Data correspond to usage on the plateform after 2015. The current usage metrics is available 48-96 hours after online publication and is updated daily on week days.
Initial download of the metrics may take a while.