Fig. 6
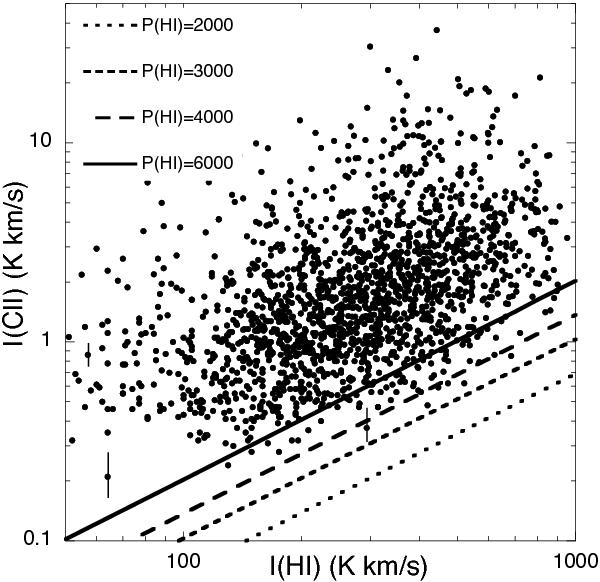
Scatter plot of I([C ii]) versus I(H i) for all [C ii] sources. The straight lines are predicted I([C ii]) for low density atomic H i diffuse clouds as a function of I(H i) (which is proportional to the H i column density) for four different characteristic pressures from P = 2000 K cm-3 to 6000 K cm-3. This pressure range covers predicted values for the diffuse clouds from Rgal ~ 10 kpc to ~4 kpc, with 3000 K cm-3 characteristic of the solar radius. It is clear that the vast majority of the GOT C+ [C ii] sources require an additional source of [C ii] emission other than the diffuse atomic gas. The 1-σ noise for I([C ii]) is indicated on three representative low intensity points; those for I(H i) are too small to be visible on this figure and have been omitted. It can be seen on the scale of this figure that the S/N is high for most of points in this scatter plot.
Current usage metrics show cumulative count of Article Views (full-text article views including HTML views, PDF and ePub downloads, according to the available data) and Abstracts Views on Vision4Press platform.
Data correspond to usage on the plateform after 2015. The current usage metrics is available 48-96 hours after online publication and is updated daily on week days.
Initial download of the metrics may take a while.