Fig. 2
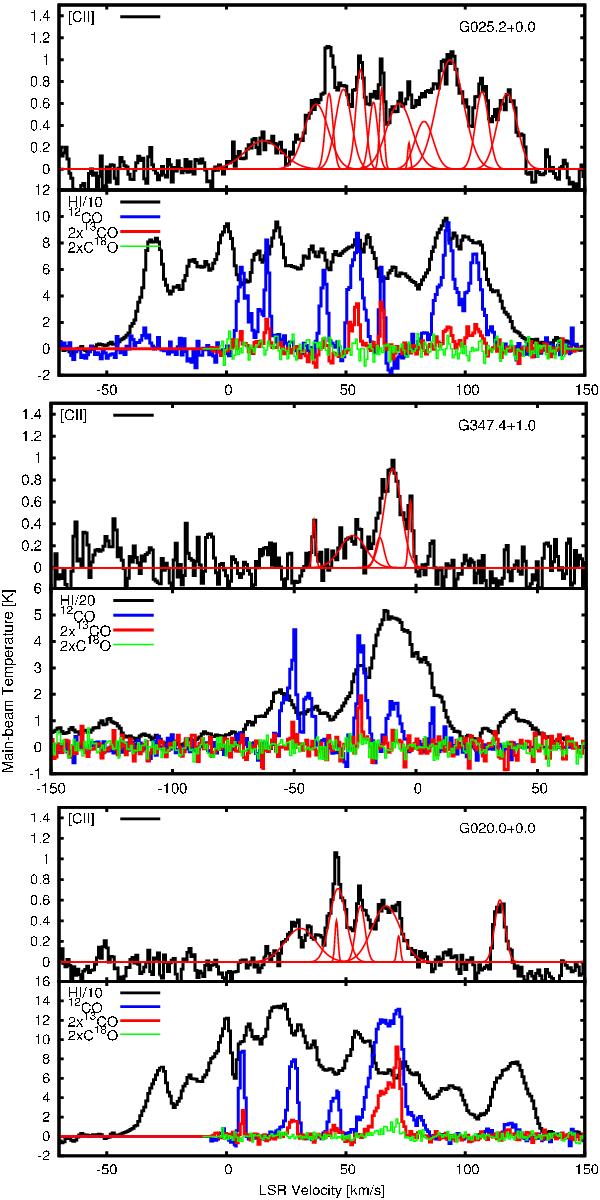
Spectra along three representative lines of sight from the GOT C+ inner Galaxy survey showing Tmb, the main-beam temperature, versus Vlsr. The upper panel for each line of sight shows the [C ii] spectrum along with the fits derived from the Gaussian decomposition (shown in red). The lower panel for each line of sight shows the corresponding H i in black, 12CO in blue, 13CO in red, and C18O in green. The scalings for Tmb are shown in each panel.
Current usage metrics show cumulative count of Article Views (full-text article views including HTML views, PDF and ePub downloads, according to the available data) and Abstracts Views on Vision4Press platform.
Data correspond to usage on the plateform after 2015. The current usage metrics is available 48-96 hours after online publication and is updated daily on week days.
Initial download of the metrics may take a while.