Fig. 17
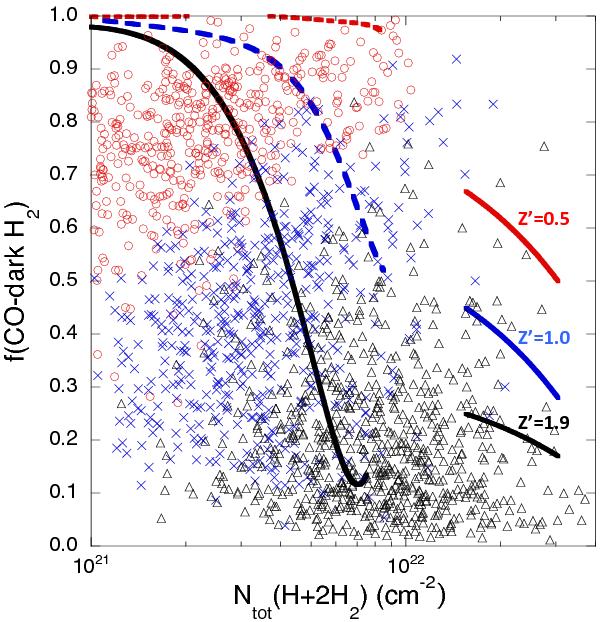
Fraction by mass of CO-dark H2 gas for all sources as a function of the total hydrogen column density Ntot = N(H i) + 2N(H2): diffuse molecular clouds (red °), 12CO transition molecular clouds (blue ×), and 13CO dense molecular clouds (black △). The curves on the left are f(CO-dark H2) calculated from the models of Visser et al. (2009) as discussed in the text. The central curve (dashed blue line) is the 100-point means of their model shown in the right panel of their Fig. 7. The top curve (dotted red line) is the lower limit on the solutions for N(CO), while the bottom curve (solid black line) is the upper limit on N(CO) as a function of N(H2) for the range of parameter space used in their models. On the right side we plot the few values of f(CO-dark H2) calculated by Wolfire et al. (2010) for massive clouds for different values of metallicity relative to the solar value, Z′ = 0.5 (red line), 1.0 (blue line), and 1.9 (black line).
Current usage metrics show cumulative count of Article Views (full-text article views including HTML views, PDF and ePub downloads, according to the available data) and Abstracts Views on Vision4Press platform.
Data correspond to usage on the plateform after 2015. The current usage metrics is available 48-96 hours after online publication and is updated daily on week days.
Initial download of the metrics may take a while.