Fig. 16
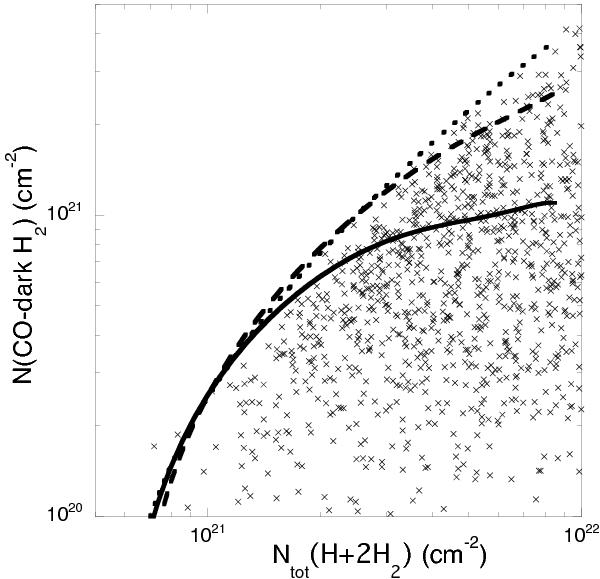
Column density of CO-dark H2 gas for all CO sources as a function of the total hydrogen column density Ntot = N(H i) + 2N(H2). The curves are N(CO-dark H2) calculated from the models of Visser et al. (2009) as discussed in the text. The central curve (dashed line) is the 100-point means of their model shown in the right panel of their Fig. 7. The top curve (dotted line) is the lower limit on the solutions for N(CO), which yields a maximum for N(CO-dark H2), and the bottom curve (solid line) is the upper limit on N(CO), which yields a minimum for N(CO-dark H2), as a function of N(H2) for the range of parameter space used in their models.
Current usage metrics show cumulative count of Article Views (full-text article views including HTML views, PDF and ePub downloads, according to the available data) and Abstracts Views on Vision4Press platform.
Data correspond to usage on the plateform after 2015. The current usage metrics is available 48-96 hours after online publication and is updated daily on week days.
Initial download of the metrics may take a while.