Fig. 1
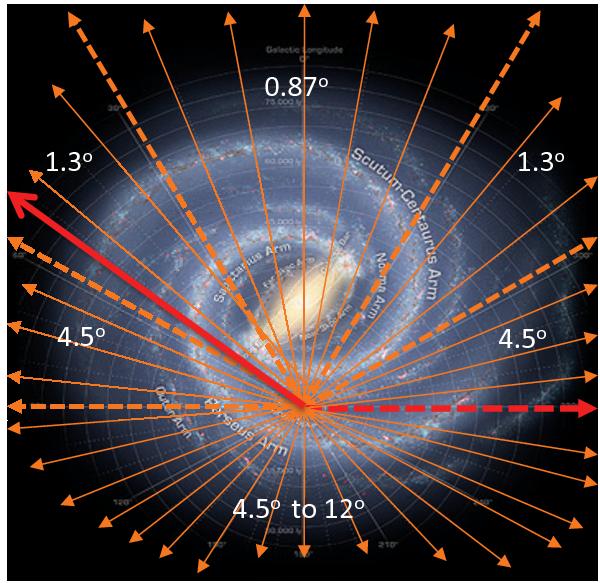
A schematic of the distribution of lines of sight for the GOT C+ Galactic plane survey where they are represented by solid arrows superimposed on an artist’s impression of the Galaxy (R. Hurt, Courtesy NASA/JPL-Caltech). Each arrow represents many lines of sight as they are too dense to display. The longitudinal spacings are indicated on the figure and regions of different angular spacing are separated by dashed arrows. The finest spacing is 0.87° towards the innermost Galaxy and increases outwards. The red lines mark the range l = 270° to 57° of data analyzed in this paper. The area covered from l = 90° to 270°, which is mostly in the outer Galaxy, is only about 20% to 25% of the area of the disk and consequently a larger angular spacing is used, varying from 4.5° at 90° and 270° to 12° near 180°.
Current usage metrics show cumulative count of Article Views (full-text article views including HTML views, PDF and ePub downloads, according to the available data) and Abstracts Views on Vision4Press platform.
Data correspond to usage on the plateform after 2015. The current usage metrics is available 48-96 hours after online publication and is updated daily on week days.
Initial download of the metrics may take a while.