Fig. 9
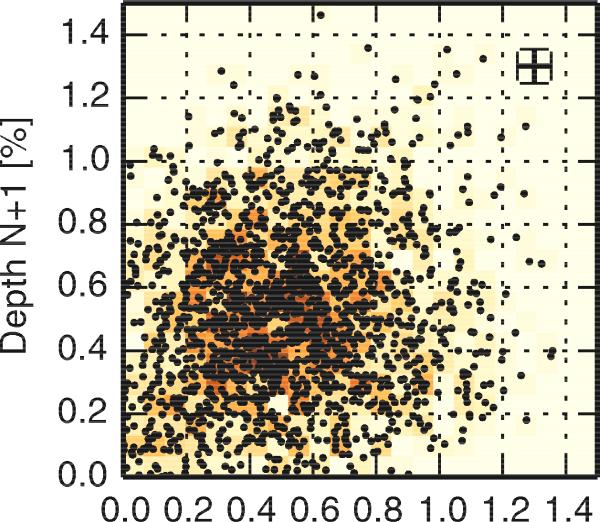
Transit depth plotted against the following transit depth, showing no correlation (R2 = 0.026). This constrains the dynamic processes that underlie the dust cloud generation. The lower-left corner is slightly overpopulated due to two quiet periods of KIC 1255b as explained in Sect. 3.1. The cross indicates the median error for the depth estimate.
Current usage metrics show cumulative count of Article Views (full-text article views including HTML views, PDF and ePub downloads, according to the available data) and Abstracts Views on Vision4Press platform.
Data correspond to usage on the plateform after 2015. The current usage metrics is available 48-96 hours after online publication and is updated daily on week days.
Initial download of the metrics may take a while.