Fig. 16
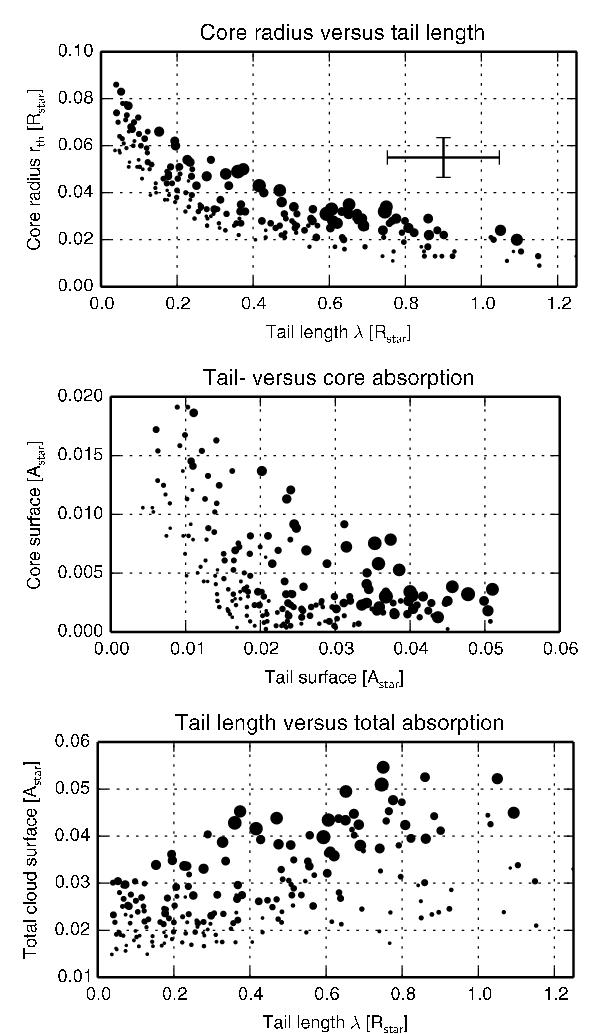
Deep (>0.5%) short cadence transit Kepler data fitted with the two-component 2D model. The point surface scales with the transit depth squared (for clarity) as determined in Sect. 3.1. The top plot shows the best-fitting model parameters rth and λ for each individual SC transit. The correlation in this plot is largely due to the model (see text). We show the effective area of the tail versus the size of the opaque core (middle), and the tail length versus total absorption (bottom). We observe no clear relation between the tail or the core absorption, while the transit depth scales with the total absorption. Very deep transits seem to require a strong tail component, as is evident by the cluster of points in the bottom-right corner of the middle panel. The void in the triangular lower-left corner in the middle panel is due to the exclusion of shallow transits, where iso-transit depth lines run diagonally.
Current usage metrics show cumulative count of Article Views (full-text article views including HTML views, PDF and ePub downloads, according to the available data) and Abstracts Views on Vision4Press platform.
Data correspond to usage on the plateform after 2015. The current usage metrics is available 48-96 hours after online publication and is updated daily on week days.
Initial download of the metrics may take a while.