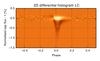
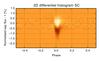
Fig. 13

2D differential histogram comparing the flux distribution at a certain phase against the out-of-eclipse flux distribution for all long- (top) and short cadence (bottom) data. Excess flux compared to the out-of-eclipse histogram shows up as bright areas. We use 100 intensity bins and 320 phase bins of width 0.0125 such that the phase bins are 4 × oversampled. Note the excess flux around phase φ = -0.1 in the long cadence data indicating the forward scattering, which is not visible in the SC data.
Current usage metrics show cumulative count of Article Views (full-text article views including HTML views, PDF and ePub downloads, according to the available data) and Abstracts Views on Vision4Press platform.
Data correspond to usage on the plateform after 2015. The current usage metrics is available 48-96 hours after online publication and is updated daily on week days.
Initial download of the metrics may take a while.