Fig. 1
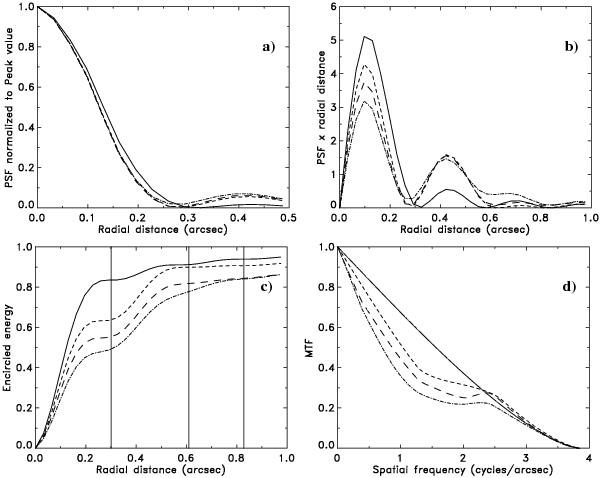
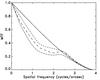
Panel a) shows the core of the angle-averaged point spread function (PSF) of Hinode, normalized to unity at its peak, panel 1b) the same PSF multiplied by the radial distance r to visualize the contributions from different radial distances. Panel c) shows the variation of the encircled energy of the PSF with distance, with the approximate locations of the first three diffraction minima indicated with vertical lines. Panel d) shows a cut through the corresponding modulation transfer function. The 4 curves in each panel correspond to Case I (full), Case II (short dashes), Case III (long dashes) and Case IV (dash-dotted), summarized in Table 1.
Current usage metrics show cumulative count of Article Views (full-text article views including HTML views, PDF and ePub downloads, according to the available data) and Abstracts Views on Vision4Press platform.
Data correspond to usage on the plateform after 2015. The current usage metrics is available 48-96 hours after online publication and is updated daily on week days.
Initial download of the metrics may take a while.