Fig. 8
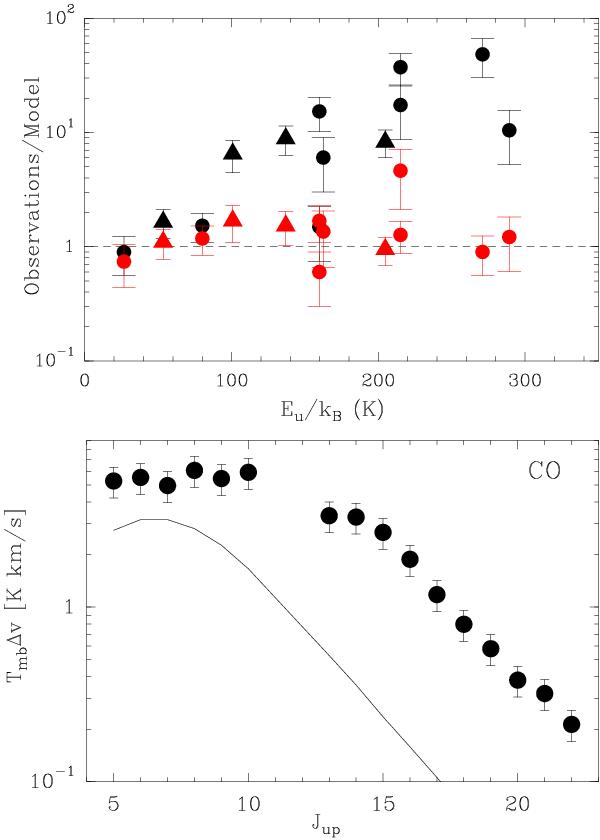
Top: ratio between the measured integrated intensities and the LVG model predictions. Filled circles/triangles depict o-H2O and p-H2O lines, respectively. In black, we display the results assuming one single temperature component (Tkin = 250 K, n(H2) = 106 cm-3, N(o-H2O) = 2 × 1014 cm-2, size = 10′′); in red, the final solution when adding the contribution of the second temperature (Tkin = 1000 K, n(H2) = 2 × 104 cm-3, N(o-H2O) = 7 × 1016 cm-2, size =  ). Bottom: predicted CO fluxes from the hot component, as a function of the rotational upper level in the HIFI and PACS range. The observed fluxes (Benedettini et al. 2012; Lefloch et al. 2012) are marked with filled circles. The choice of [CO]/[H2O] = 1 provides an upper limit estimate of the CO integrated intensity (see Sect. 4.2.3 for more details).
Current usage metrics show cumulative count of Article Views (full-text article views including HTML views, PDF and ePub downloads, according to the available data) and Abstracts Views on Vision4Press platform.
Data correspond to usage on the plateform after 2015. The current usage metrics is available 48-96 hours after online publication and is updated daily on week days.
Initial download of the metrics may take a while.