Fig. 7
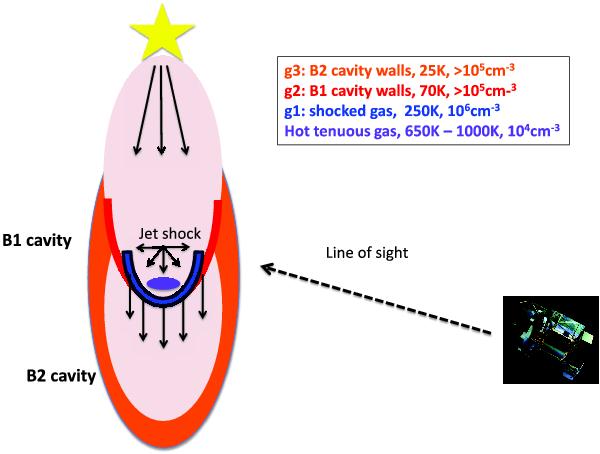
L1157 blue-lobe outflow system. The B1 and B2 outflow cavities are indicated in red and orange, respectively. The two shock components identified through H2O lines are displayed in blue (warm shocked gas) and in light violet for the hot tenuous gas. In the top right corner of the image we show the physical conditions of each component. The observer, represented by the Herschel satellite, is indicated on the right side of the image.
Current usage metrics show cumulative count of Article Views (full-text article views including HTML views, PDF and ePub downloads, according to the available data) and Abstracts Views on Vision4Press platform.
Data correspond to usage on the plateform after 2015. The current usage metrics is available 48-96 hours after online publication and is updated daily on week days.
Initial download of the metrics may take a while.