Fig. 6
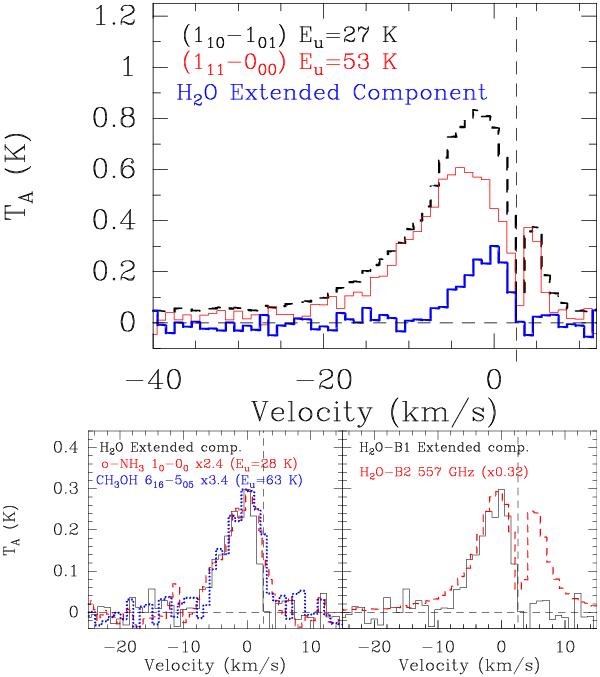
Top: comparison of HIFI spectra for H2O transitions connecting with the ground state: o-H2O (110 − 101) shown by the dashed black line and p-H2O (111 − 000) shown by the thin solid red line. The spectrum shown in blue (solid thick line) is the residual emission after subtracting the emission of p-H2O (111 − 000) line from the o-H2O (110 − 101), referred to as the extended component. Bottom: comparison of the extended component seen in the H2O (110 − 101) line (solid black line) with the o-NH3 (10 − 00) (dashed red line) and the CH3OH (616 − 505) (dotted blue line) spectra obtained from Codella et al. (2010) (left panel). Comparison of the o-H2O (110 − 101) line at 556.9 GHz observed in B1 (extended component; solid black line) and in L1157-B2 (dashed red line) from Vasta et al. (2012). In all panels the vertical dashed line marks the ambient LSR velocity vLSR ~ 2.6 kms-1 (Bachiller & Pérez Gutiérrez 1997).
Current usage metrics show cumulative count of Article Views (full-text article views including HTML views, PDF and ePub downloads, according to the available data) and Abstracts Views on Vision4Press platform.
Data correspond to usage on the plateform after 2015. The current usage metrics is available 48-96 hours after online publication and is updated daily on week days.
Initial download of the metrics may take a while.