Fig. 6
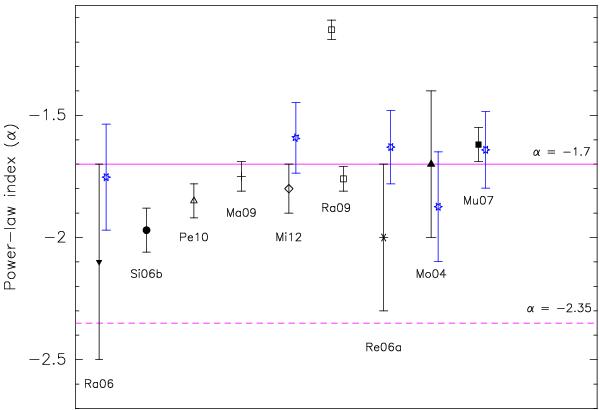
Comparison of α values from the literature and our estimates. All symbols but six-pointed stars represent values obtained by other authors. Six-pointed star symbols represent our estimations taking different assumptions into account. Vertical lines represent the 1σ uncertainties. Horizontal lines show the index of the CO clump mass distribution (solid line) and the index of the IMF (broken line). References: Ra06 (Rathborne et al. 2006), Si06b (Simon et al. 2006b), Pe10 (Peretto & Fuller 2010), Ma09 (Marshall et al. 2009), Mi12 (Miettinen 2012), Ra09 (Ragan et al. 2009), Re06a (Reid & Wilson 2006a), Mo04 (Mookerjea et al. 2004), Mu07 (Muñoz et al. 2007).
Current usage metrics show cumulative count of Article Views (full-text article views including HTML views, PDF and ePub downloads, according to the available data) and Abstracts Views on Vision4Press platform.
Data correspond to usage on the plateform after 2015. The current usage metrics is available 48-96 hours after online publication and is updated daily on week days.
Initial download of the metrics may take a while.