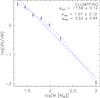
Fig. 5
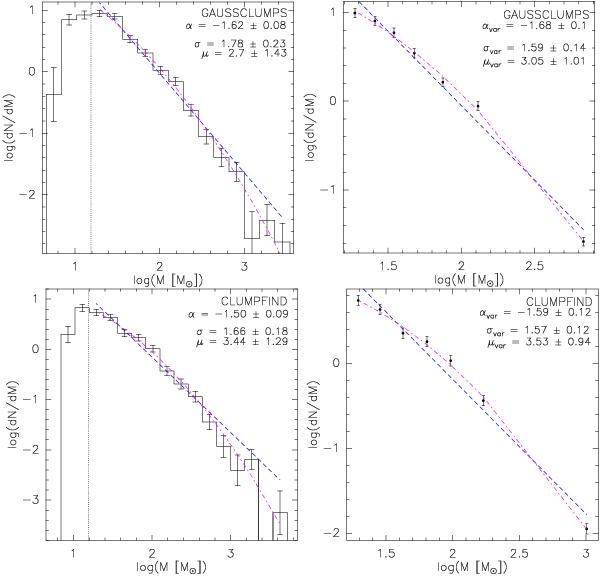
Differential mass functions, dN/dM ∝ Mα, for clumps from Gaussclumps (upper panels) and clumps from Clumpfind (lower panels). The dashed blue lines represent fits to single power laws and the dot-dashed pink lines represent the fits to log-normal distributions. The parameters α, σ, and μ are given in each panel. The vertical dotted lines indicate the 6σrms (15 M⊙) mass given by the noisiest map.
Current usage metrics show cumulative count of Article Views (full-text article views including HTML views, PDF and ePub downloads, according to the available data) and Abstracts Views on Vision4Press platform.
Data correspond to usage on the plateform after 2015. The current usage metrics is available 48-96 hours after online publication and is updated daily on week days.
Initial download of the metrics may take a while.