Fig. 4
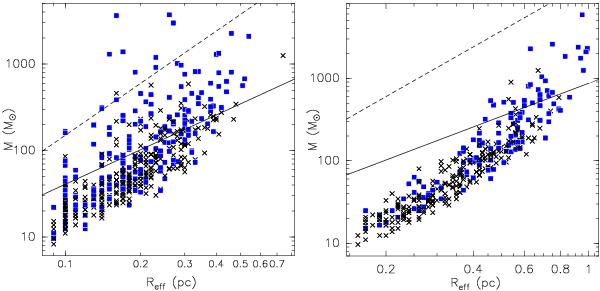
Mass-size plots for clumps extracted with Gaussclumps (left panel) and Clumpfind (right panel) for all clumps in our IRDCs. The solid lines represent the empirical lower limit threshold for high-mass star formation  found by Kauffmann & Pillai (2010), while the dashed lines represent the theoretical minimum threshold of 1 g cm-2 proposed by Krumholz & McKee (2008). Blue filled squares represent clumps associated with any of the following signposts of star formation: IRAS/MSX/24-μm point sources, masers, HII regions, and/or UCHII regions. Crosses represent clumps with no reported signpost of star formation.
Current usage metrics show cumulative count of Article Views (full-text article views including HTML views, PDF and ePub downloads, according to the available data) and Abstracts Views on Vision4Press platform.
Data correspond to usage on the plateform after 2015. The current usage metrics is available 48-96 hours after online publication and is updated daily on week days.
Initial download of the metrics may take a while.