Free Access
Fig. 3
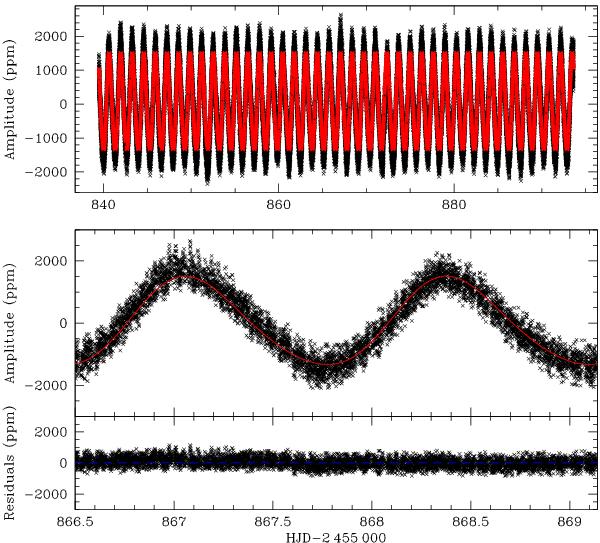
CoRoT light curve with the Fourier fit superimposed (red line). The upper panel shows the full light curve, while the two bottom ones only show two cycles and the residuals (observations minus fit). The 1σ dispersion of the residuals is ~300 ppm.
Current usage metrics show cumulative count of Article Views (full-text article views including HTML views, PDF and ePub downloads, according to the available data) and Abstracts Views on Vision4Press platform.
Data correspond to usage on the plateform after 2015. The current usage metrics is available 48-96 hours after online publication and is updated daily on week days.
Initial download of the metrics may take a while.