Free Access
Fig. 2
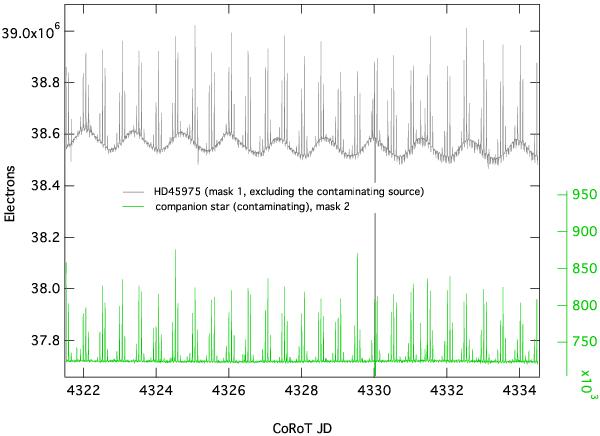
Light curves (electrons vs. CoRoT Julian days) of HD 45975 and the contaminant. Upper grey line: light curve using mask 1 (around HD 45975; y-axis to the left). Bottom green line: light curve using mask 2 (around the companion star; y-axis to the right, in the same units as the left axis, but on a different scale).
Current usage metrics show cumulative count of Article Views (full-text article views including HTML views, PDF and ePub downloads, according to the available data) and Abstracts Views on Vision4Press platform.
Data correspond to usage on the plateform after 2015. The current usage metrics is available 48-96 hours after online publication and is updated daily on week days.
Initial download of the metrics may take a while.