Free Access
Fig. 15
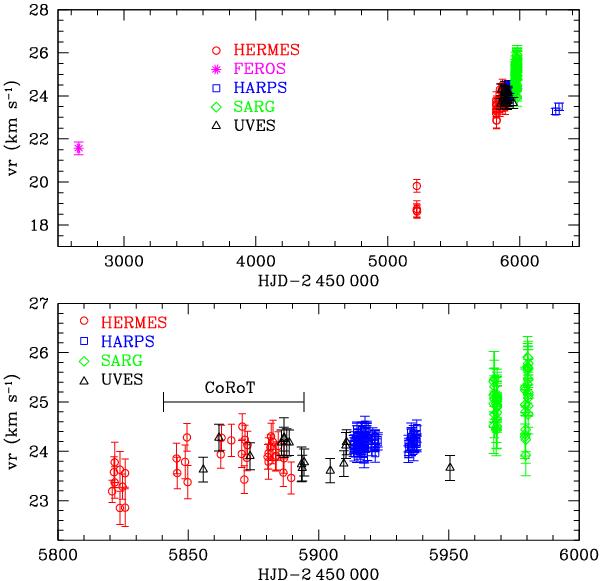
Variations in the centroid of Mg ii λ4481 Å as a function of the observation date (this line is not covered by the Tautenburg spectra). The upper panel shows the whole dataset, while the lower panel shows the observations obtained close to the CoRoT observations.
Current usage metrics show cumulative count of Article Views (full-text article views including HTML views, PDF and ePub downloads, according to the available data) and Abstracts Views on Vision4Press platform.
Data correspond to usage on the plateform after 2015. The current usage metrics is available 48-96 hours after online publication and is updated daily on week days.
Initial download of the metrics may take a while.