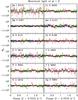
Fig. 10
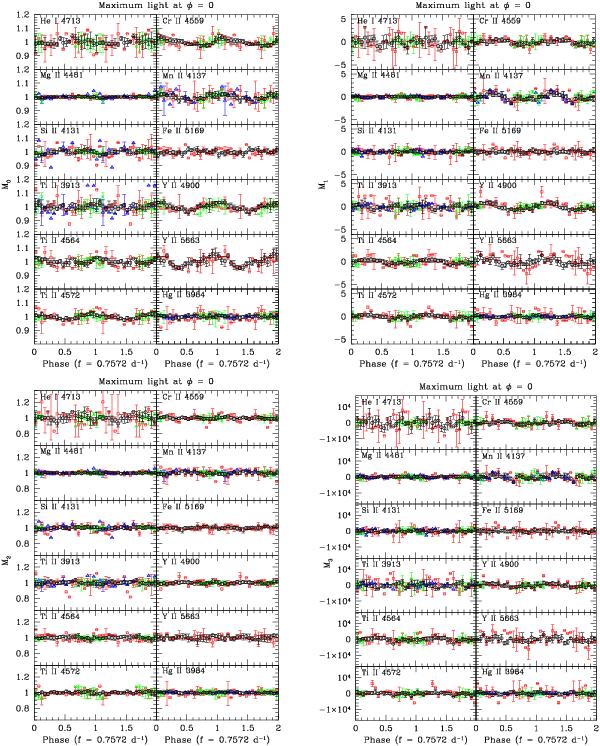
Variations of the zeroth (top left panels), first (top right panels), second (bottom left panels), and third (bottom right panels) line-profile moments as a function of phase (circles: HARPS, squares: HERMES, triangles: UVES, and crosses: SARG data). For the zeroth and second moments, the data shown are normalised to the mean value for a given dataset. For the first and third moments, these are the deviations with respect to the mean value for a given dataset. The data have been grouped into 0.05-phase bins. The uncertainties are the 1σ dispersion of the measurements within a given phase bin. Data points without error bars are based on a single measurement. Phase zero is fixed at maximum light according to the CoRoT light curve.
Current usage metrics show cumulative count of Article Views (full-text article views including HTML views, PDF and ePub downloads, according to the available data) and Abstracts Views on Vision4Press platform.
Data correspond to usage on the plateform after 2015. The current usage metrics is available 48-96 hours after online publication and is updated daily on week days.
Initial download of the metrics may take a while.