Fig. 1
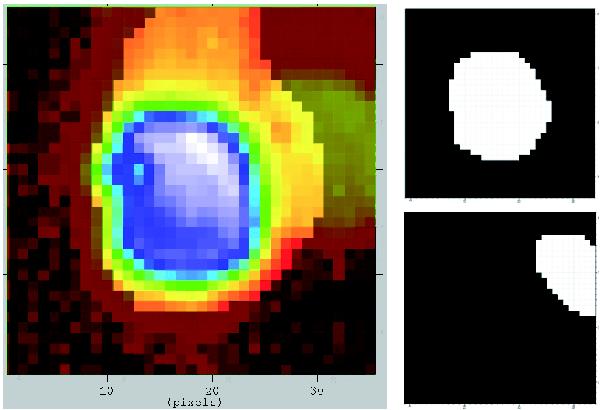
CoRoT “imagettes” of HD 45975. The left panel shows the first 2D image (35 × 35 pixels) of the series of 2193 consecutive ones analysed for this paper. The colour levels correspond to the number of collected photons (white to blue are for the brightest pixels, yellow, red to black for the faintest). The darker area around the target shows the mask used for the light curve delivered as N2 data. North is to the right and east at the bottom. The image scale is 2.3″ pixel-1. Masks 1 and 2 are shown in the upper and bottom right panels, respectively.
Current usage metrics show cumulative count of Article Views (full-text article views including HTML views, PDF and ePub downloads, according to the available data) and Abstracts Views on Vision4Press platform.
Data correspond to usage on the plateform after 2015. The current usage metrics is available 48-96 hours after online publication and is updated daily on week days.
Initial download of the metrics may take a while.