Free Access
Fig. 2
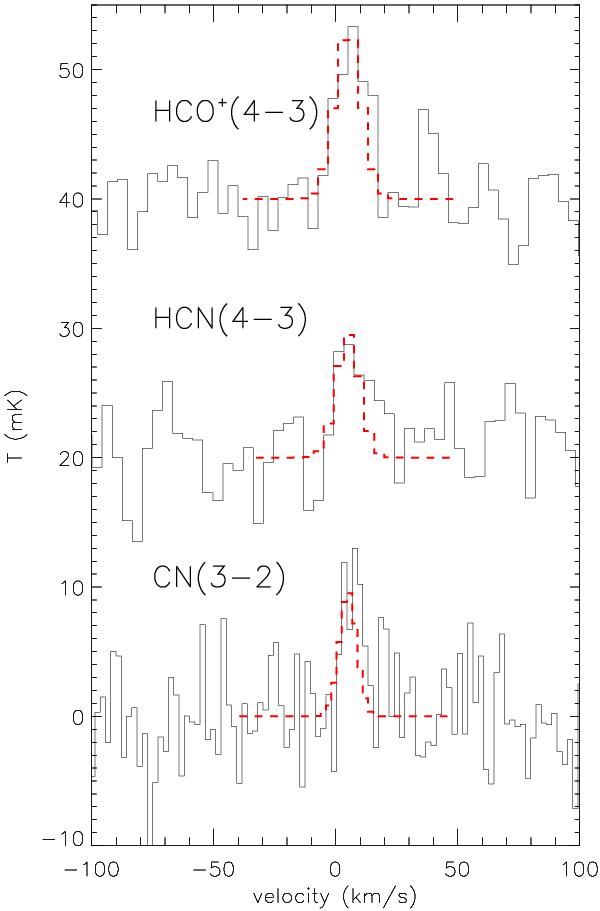
Observed emission in the HCO+ (4–3), HCN (4–3), and CN (3–2) transitions from T Cha. The best fits of the lines with a gaussian profile are shown with red dashed curves. The baseline of HCO+ (4–3), HCN (4–3) are offset in temperature to provide a better comparison of the line profiles.
Current usage metrics show cumulative count of Article Views (full-text article views including HTML views, PDF and ePub downloads, according to the available data) and Abstracts Views on Vision4Press platform.
Data correspond to usage on the plateform after 2015. The current usage metrics is available 48-96 hours after online publication and is updated daily on week days.
Initial download of the metrics may take a while.