Fig. 6
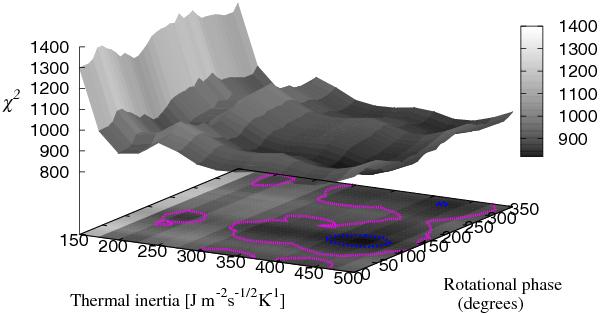
Minimum χ2 vs. thermal inertia vs. initial rotational phase. “Minimum χ2” refers to the minimum among all four models with different surface roughnesses. The projection onto the Γ−ϕ0 plane shows the 1σ (dark blue) and 3σ (pink) contours. The initial rotational phase that best fits the data is verified in the epoch 2010 January 25 00:49:29.6 UT.
Current usage metrics show cumulative count of Article Views (full-text article views including HTML views, PDF and ePub downloads, according to the available data) and Abstracts Views on Vision4Press platform.
Data correspond to usage on the plateform after 2015. The current usage metrics is available 48-96 hours after online publication and is updated daily on week days.
Initial download of the metrics may take a while.