Fig. 4
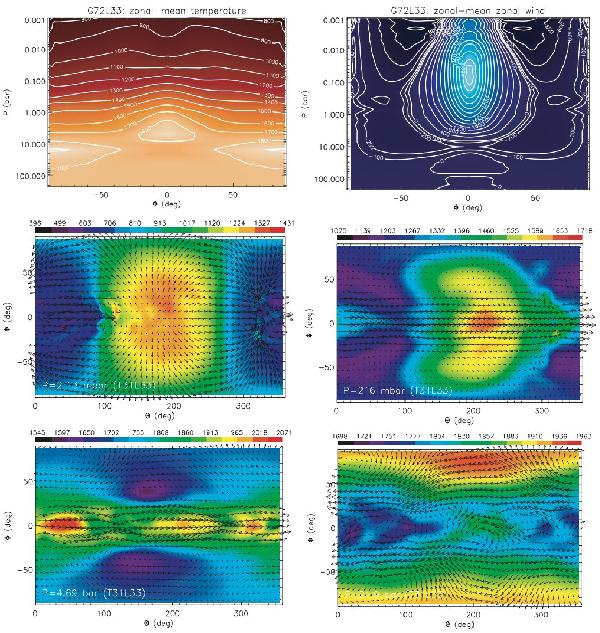
Results for the HD 209458b test case reproduced from Heng et al. (2011) (reproduced by permission of Oxford University Press). The top row shows the zonal mean plots (i.e. zonally and temporally, from 200–1200 days, averaged, using bar as the unit of pressure) of temperature (left) and zonal wind (right). The middle and bottom rows show the temperature (colour) and horizontal velocities (vectors) at pressures 213 (middle left), 21 600 (middle right), 4.69 × 10⁵ (bottom left) and 21.9 × 10⁵ Pa (bottom right) after 1200 days.
Current usage metrics show cumulative count of Article Views (full-text article views including HTML views, PDF and ePub downloads, according to the available data) and Abstracts Views on Vision4Press platform.
Data correspond to usage on the plateform after 2015. The current usage metrics is available 48-96 hours after online publication and is updated daily on week days.
Initial download of the metrics may take a while.