Free Access
Fig. 7
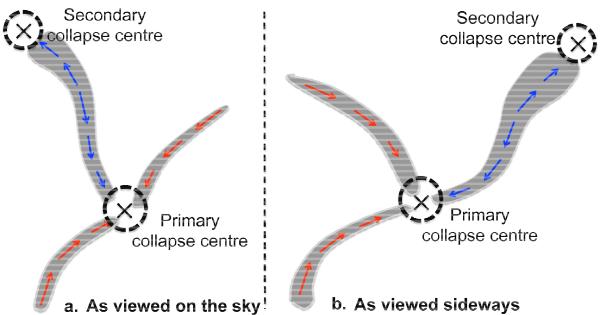
Schematic representation of the the SDC13 velocity field (arrows) a) as viewed on the plane of the sky; b) as viewed sideways with the observer on the left-hand-side of the plot. The two centres of collapse are symbolised by black dashed circles and a cross at their centres.
Current usage metrics show cumulative count of Article Views (full-text article views including HTML views, PDF and ePub downloads, according to the available data) and Abstracts Views on Vision4Press platform.
Data correspond to usage on the plateform after 2015. The current usage metrics is available 48-96 hours after online publication and is updated daily on week days.
Initial download of the metrics may take a while.