Free Access
Fig. 4
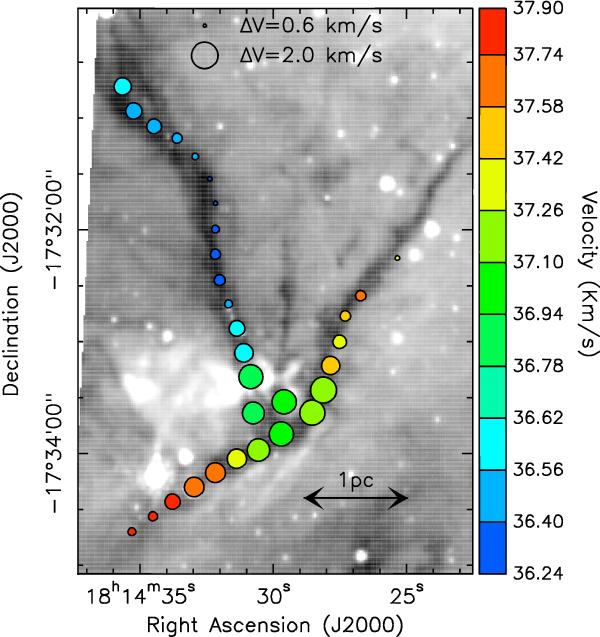
Spitzer 8 μm image of SDC13 in grey scale on top of which we symbolised the results of the N2H+(1–0) HFS fitting as circles. The colour of the symbols indicate the gas velocity while their sizes indicate the gas velocity dispersion (FWHM).
Current usage metrics show cumulative count of Article Views (full-text article views including HTML views, PDF and ePub downloads, according to the available data) and Abstracts Views on Vision4Press platform.
Data correspond to usage on the plateform after 2015. The current usage metrics is available 48-96 hours after online publication and is updated daily on week days.
Initial download of the metrics may take a while.