Fig. 2
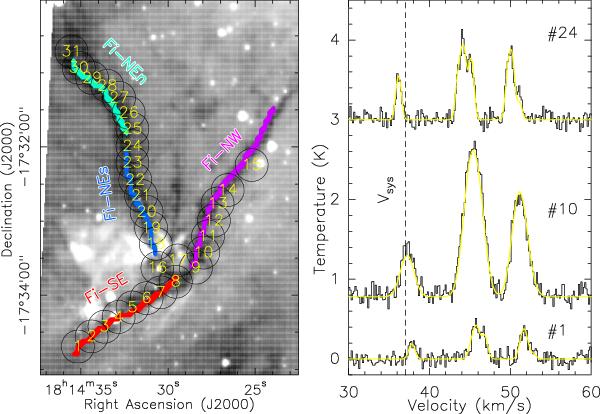
Left: Spitzer 8 μm image of
SDC13 in grey scale on top of which we marked the 31 single-pointing positions we
observed in N2H+(1–0), and the skeletons of each filament
(thick solid lines). The size of the black circles represents the 30 m beam size at
3.2 mm. Right: examples of three N2H+(1–0)
spectra (displayed on  temperature scale) observed at three different positions (1, 10, and 24). Their
corresponding hyperfine structure fits are displayed as yellow solid lines. The
remaining spectra are displayed in Fig. 3. The
vertical dashed line corresponds to the systemic velocity of the cloud (i.e.
Vsys = 37.0 km s-1) as measured from the
isolated component of the hyperfine structure.
temperature scale) observed at three different positions (1, 10, and 24). Their
corresponding hyperfine structure fits are displayed as yellow solid lines. The
remaining spectra are displayed in Fig. 3. The
vertical dashed line corresponds to the systemic velocity of the cloud (i.e.
Vsys = 37.0 km s-1) as measured from the
isolated component of the hyperfine structure.
Current usage metrics show cumulative count of Article Views (full-text article views including HTML views, PDF and ePub downloads, according to the available data) and Abstracts Views on Vision4Press platform.
Data correspond to usage on the plateform after 2015. The current usage metrics is available 48-96 hours after online publication and is updated daily on week days.
Initial download of the metrics may take a while.